


Commercial premises for rent in Europe
There are 284,065 available commercial properties in Europe right now. Companyspace.com collects commercial properties from many different parts of the market, so that you as a company can more easily get an overview of available commercial properties in Europe.
Companyspace.com today:
Updated 24h 2,952
Latest update 4 h ago
Active ads 369,199
284,065 company spaces found
Commercial space in Mondovì, Piemonte
 More info
Commercial space in Mondovì, Piemonte
Commercial space for rent in Mondovì, Piemonte
Areal
Ca. 315 m2
Pris pr. md.
Ca. 900 EUR pr md
Område
Mondovì, Piemonte
Type
Commercial property
Office space in Athens Kolonaki, Athens
 More info
Office space in Athens Kolonaki, Athens
Office space for rent in Athens Kolonaki, Athens
Areal
Ca. 155 m2
Pris pr. md.
Ca. 2,750 EUR pr md
Område
Athens Kolonaki, Athens
Type
Office space
Commercial space in Haarlem, North Holland
 More info
Commercial space in Haarlem, North Holland
Commercial space for rent in Haarlem, North Holland
Areal
Ca. 100 m2
Pris pr. md.
Ca. 1,500 EUR pr md
Område
Haarlem, North Holland
Type
Commercial property
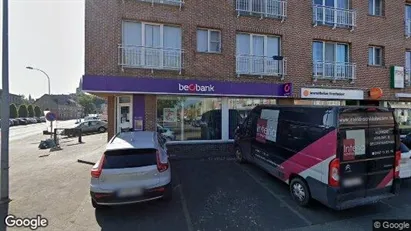
Commercial space in Heist-op-den-Berg, Antwerp (Province)
 More info
Commercial space in Heist-op-den-Berg, Antwerp (Province)
Commercial space for rent in Heist-op-den-Berg, Antwerp (Province)
Areal
Ca. 115 m2
Pris pr. md.
Ca. 1,400 EUR pr md
Område
Heist-op-den-Berg, Antwerp (Province)
Type
Commercial property
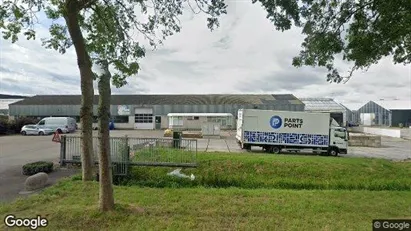
Commercial space in Venray, Limburg
 More info
Commercial space in Venray, Limburg
TE HUUR | BEDRIJFSRUIMTE | KEIZERSVELD | BEDRIJVENTERREIN KEIZERSVELD | VENRAY | CIRCA 1.212 M²
Dit bedrijfspand is gelegen op bedrijventerrein Keizersvel...
Areal
Ca. 945 m2
Pris pr. md.
Ca. 8,350 EUR pr md
Område
Venray, Limburg
Type
Commercial property
Commercial space in Mortsel, Antwerp (Province)
 More info
Commercial space in Mortsel, Antwerp (Province)
Commercial space for rent in Mortsel, Antwerp (Province)
Areal
Ca. 130 m2
Pris pr. md.
Ca. 1,400 EUR pr md
Område
Mortsel, Antwerp (Province)
Type
Commercial property
Commercial space in Gemert-Bakel, North Brabant
 More info
Commercial space in Gemert-Bakel, North Brabant
Commercial space for rent in Gemert-Bakel, North Brabant
Areal
Ca. 75 m2
Pris pr. md.
Ca. 1,050 EUR pr md
Område
Gemert-Bakel, North Brabant
Type
Commercial property
Commercial space in Amberg, Bayern
 More info
Commercial space in Amberg, Bayern
Commercial space for rent in Amberg, Bayern
Areal
Ca. 20 m2
Pris pr. md.
Ca. 62,200 EUR pr md
Område
Amberg, Bayern
Type
Commercial property
Office space in Orbassano, Piemonte
 More info
Office space in Orbassano, Piemonte
Office space for rent in Orbassano, Piemonte
Areal
Ca. 115 m2
Pris pr. md.
Ca. 250 EUR pr md
Område
Orbassano, Piemonte
Type
Office space
Office space in Vantaa, Uusimaa
 More info
Office space in Vantaa, Uusimaa
Office space for rent in Vantaa, Uusimaa
Areal
Ca. 45 m2
Pris pr. md.
Not stated
Område
Vantaa, Uusimaa
Type
Office space
Office space in Kastrup, Copenhagen
 More info
Office space in Kastrup, Copenhagen
Office space for rent in Kastrup, Copenhagen
Areal
Ca. 365 m2
Pris pr. md.
Ca. 42,700 DKK pr md
Område
Kastrup, Copenhagen
Type
Office space
Office space in Skovlunde, Greater Copenhagen
 More info
Office space in Skovlunde, Greater Copenhagen
Office space for rent in Skovlunde, Greater Copenhagen
Areal
Ca. 305 m2
Pris pr. md.
Ca. 15,250 DKK pr md
Område
Skovlunde, Greater Copenhagen
Type
Office space
Commercial space in Brunssum, Limburg
 More info
Commercial space in Brunssum, Limburg
Commercial space for rent in Brunssum, Limburg
Areal
-
Pris pr. md.
Ca. 50 EUR pr md
Område
Brunssum, Limburg
Type
Commercial property
Office space in Tampere Keskinen, Tampere
 More info
Office space in Tampere Keskinen, Tampere
Office space for rent in Tampere Keskinen, Tampere
Areal
-
Pris pr. md.
Not stated
Område
Tampere Keskinen, Tampere
Type
Office space
Commercial space in Amstelveen, North Holland
 More info
Commercial space in Amstelveen, North Holland
Commercial space for rent in Amstelveen, North Holland
Areal
Ca. 11,500 m2
Pris pr. md.
Ca. 50 EUR pr md
Område
Amstelveen, North Holland
Type
Commercial property
Commercial space in Lier, Antwerp (Province)
 More info
Commercial space in Lier, Antwerp (Province)
Commercial space for rent in Lier, Antwerp (Province)
Areal
Ca. 295 m2
Pris pr. md.
Ca. 3,950 EUR pr md
Område
Lier, Antwerp (Province)
Type
Commercial property
Office space in Kluisbergen, Oost-Vlaanderen
 More info
Office space in Kluisbergen, Oost-Vlaanderen
Office space for rent in Kluisbergen, Oost-Vlaanderen
Areal
Ca. 165 m2
Pris pr. md.
Ca. 1,900 EUR pr md
Område
Kluisbergen, Oost-Vlaanderen
Type
Office space
Commercial space in Heist-op-den-Berg, Antwerp (Province)
 More info
Commercial space in Heist-op-den-Berg, Antwerp (Province)
Commercial space for rent in Heist-op-den-Berg, Antwerp (Province)
Areal
Ca. 70 m2
Pris pr. md.
Ca. 900 EUR pr md
Område
Heist-op-den-Berg, Antwerp (Province)
Type
Commercial property
Selected customers
30,000 customers use Companyspace.com
30,000 customers
285,000 companies in our database
2,400 rentals annually
Companyspace.com is used by thousands of landlords, property companies, commercial real estate agents, investors and business centres seeking greater visibility, more enquiries and lower vacancy rates.


