


Commercial premises for rent in Europe
There are 271,385 available commercial properties in Europe right now. Companyspace.com collects commercial properties from many different parts of the market, so that you as a company can more easily get an overview of available commercial properties in Europe.
Companyspace.com today:
New today 224
Updated 24h 1,151
Notifications about new companyspaces99
Copenhagen +3
Amsterdam +1
Brussels +2
Vienna +14
Latest update 3 min ago
Active ads 357,732
271,385 company spaces found
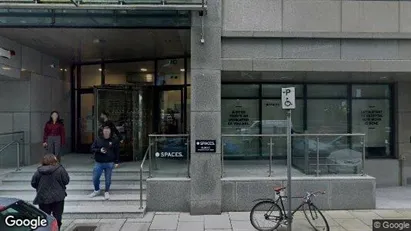
Office space in Dublin 18, Dublin
 More info
Office space in Dublin 18, Dublin
Office space for rent in Dublin 18, Dublin
Areal
Ca. 30 m2
Pris pr. md.
Ca. 2,450 EUR pr md
Område
Dublin 18, Dublin
Type
Office space
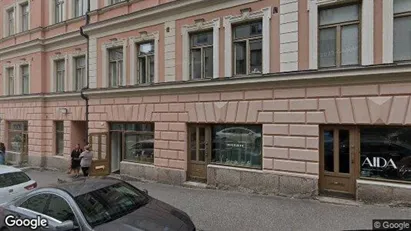
Office space in Dublin 2, Dublin
 More info
Office space in Dublin 2, Dublin
Office space for rent in Dublin 2, Dublin
Areal
Ca. 15 m2
Pris pr. md.
Ca. 2,500 EUR pr md
Område
Dublin 2, Dublin
Type
Office space
Warehouse in Åbyhøj, Aarhus
 More info
Warehouse in Åbyhøj, Aarhus
Warehouse for rent in Åbyhøj, Aarhus
Areal
Ca. 1,110 m2
Pris pr. md.
Ca. 44,000 DKK pr md
Område
Åbyhøj, Aarhus
Type
Warehouse
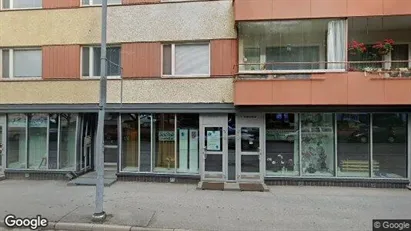
Commercial space in Helsinki Eteläinen, Helsinki
 More info
Commercial space in Helsinki Eteläinen, Helsinki
Commercial space for rent in Helsinki Eteläinen, Helsinki
Areal
Ca. 40 m2
Pris pr. md.
Ca. 900 EUR pr md
Område
Helsinki Eteläinen, Helsinki
Type
Commercial property
Commercial space in Venlo, Limburg
 More info
Commercial space in Venlo, Limburg
Commercial space for rent in Venlo, Limburg
Areal
Ca. 250 m2
Pris pr. md.
Ca. 1,950 EUR pr md
Område
Venlo, Limburg
Type
Commercial property
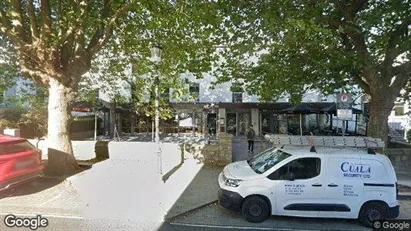
Office space in Dun Laoghaire, Dublin (county)
 More info
Office space in Dun Laoghaire, Dublin (county)
Office space for rent in Dun Laoghaire, Dublin (county)
Areal
Ca. 15 m2
Pris pr. md.
Ca. 1,250 EUR pr md
Område
Dun Laoghaire, Dublin (county)
Type
Office space
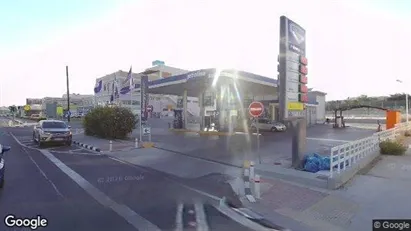
Office space in Agios Athanasios, Limassol (Eparchies)
 More info
Office space in Agios Athanasios, Limassol (Eparchies)
Office space for rent in Agios Athanasios, Limassol (Eparchies)
Areal
-
Pris pr. md.
Ca. 7,900 EUR pr md
Område
Agios Athanasios, Limassol (Eparchies)
Type
Office space
Office space in Stad Antwerp, Antwerp
 More info
Office space in Stad Antwerp, Antwerp
Office space for rent in Stad Antwerp, Antwerp
Areal
-
Pris pr. md.
Ca. 1,500 EUR pr md
Område
Stad Antwerp, Antwerp
Type
Office space
Office space in Aalten, Gelderland
 More info
Office space in Aalten, Gelderland
Office space for rent in Aalten, Gelderland
Areal
Ca. 35 m2
Pris pr. md.
Ca. 450 EUR pr md
Område
Aalten, Gelderland
Type
Office space
Commercial space in Zeewolde, Flevoland
 More info
Commercial space in Zeewolde, Flevoland
Commercial space for rent in Zeewolde, Flevoland
Areal
Ca. 485 m2
Pris pr. md.
Ca. 2,900 EUR pr md
Område
Zeewolde, Flevoland
Type
Commercial property
Commercial space in Pori, Satakunta
 More info
Commercial space in Pori, Satakunta
Commercial space for rent in Pori, Satakunta
Areal
Ca. 40 m2
Pris pr. md.
Ca. 450 EUR pr md
Område
Pori, Satakunta
Type
Commercial property
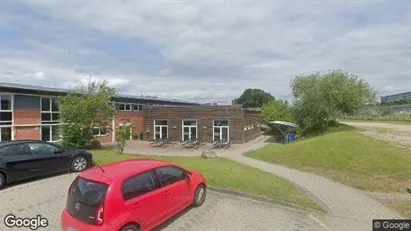
Office space in Viby J, Aarhus
 More info
Office space in Viby J, Aarhus
Office space for rent in Viby J, Aarhus
Areal
Ca. 1,140 m2
Pris pr. md.
Ca. 71,250 DKK pr md
Område
Viby J, Aarhus
Type
Office space
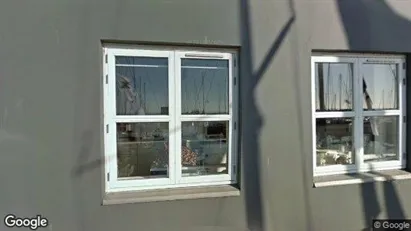
Office space in Aarhus C, Aarhus
 More info
Office space in Aarhus C, Aarhus
Office space for rent in Aarhus C, Aarhus
Areal
Ca. 350 m2
Pris pr. md.
Ca. 58,650 DKK pr md
Område
Aarhus C, Aarhus
Type
Office space
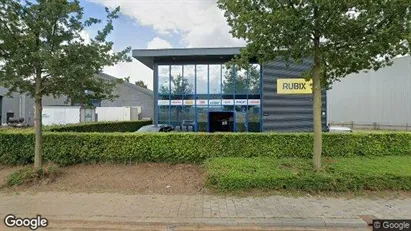
Commercial space in Doetinchem, Gelderland
 More info
Commercial space in Doetinchem, Gelderland
TE HUUR - Fabriekstraat 42 in Doetinchem
Moderne kantoor/showroom ruimte met magazijn, uitstekend gelegen op bedrijventerrein "Verheulsweide" in Doetinc...
Areal
-
Pris pr. md.
Ca. 3,750 EUR pr md
Område
Doetinchem, Gelderland
Type
Commercial property
Office space in Gent Sint-Denijs-Westrem, Gent
 More info
Office space in Gent Sint-Denijs-Westrem, Gent
Office space for rent in Gent Sint-Denijs-Westrem, Gent
Areal
Ca. 610 m2
Pris pr. md.
Ca. 9,450 EUR pr md
Område
Gent Sint-Denijs-Westrem, Gent
Type
Office space
Office space in Den Bosch, North Brabant
 More info
Office space in Den Bosch, North Brabant
Office space for rent in Den Bosch, North Brabant
Areal
Ca. 220 m2
Pris pr. md.
Ca. 1,650 EUR pr md
Område
Den Bosch, North Brabant
Type
Office space
Office space in Ternat, Vlaams-Brabant
 More info
Office space in Ternat, Vlaams-Brabant
Office space for rent in Ternat, Vlaams-Brabant
Areal
Ca. 620 m2
Pris pr. md.
Ca. 5,150 EUR pr md
Område
Ternat, Vlaams-Brabant
Type
Office space
Commercial space in Kirkkonummi, Uusimaa
 More info
Commercial space in Kirkkonummi, Uusimaa
Commercial space for rent in Kirkkonummi, Uusimaa
Areal
Ca. 145 m2
Pris pr. md.
Ca. 1,550 EUR pr md
Område
Kirkkonummi, Uusimaa
Type
Commercial property
Selected customers
30,000 customers use Companyspace.com
30,000 customers
285,000 companies in our database
2,400 rentals annually
Companyspace.com is used by thousands of landlords, property companies, commercial real estate agents, investors and business centres seeking greater visibility, more enquiries and lower vacancy rates.


