


Commercial premises for rent in Europe
There are 283,981 available commercial properties in Europe right now. Companyspace.com collects commercial properties from many different parts of the market, so that you as a company can more easily get an overview of available commercial properties in Europe.
Companyspace.com today:
New today 2,899
Updated 24h 3,921
Notifications about new companyspaces1,854
Copenhagen +2
Stockholm +1
Amsterdam +3
Berlin +3
Vienna +6
Paris +5
Madrid +4
Dublin (county) +23
Warsaw +19
Greater London +13
Latest update 26 min ago
Active ads 369,114
283,981 company spaces found
Commercial space in Uppsala, Uppsala County
 More info
Commercial space in Uppsala, Uppsala County
Commercial space for rent in Uppsala, Uppsala County
Areal
Ca. 985 m2
Pris pr. md.
Not stated
Område
Uppsala, Uppsala County
Type
Commercial property
Commercial space in Nitra, Nitriansky kraj
 More info
Commercial space in Nitra, Nitriansky kraj
Commercial space for rent in Nitra, Nitriansky kraj
Areal
-
Pris pr. md.
Not stated
Område
Nitra, Nitriansky kraj
Type
Commercial property
Office space in Dublin 7, Dublin
 More info
Office space in Dublin 7, Dublin
Office space for rent in Dublin 7, Dublin
Areal
Ca. 55 m2
Pris pr. md.
Ca. 3,000 EUR pr md
Område
Dublin 7, Dublin
Type
Office space
Warehouse in London E8, Greater London
 More info
Warehouse in London E8, Greater London
Warehouse for rent in London E8, Greater London
Areal
Ca. 355 m2
Pris pr. md.
Ca. 4,800 GBP pr md
Område
London E8, Greater London
Type
Warehouse
Office space in Vesterbro, Copenhagen
 More info
Office space in Vesterbro, Copenhagen
Office space for rent in Vesterbro, Copenhagen
Areal
Ca. 635 m2
Pris pr. md.
Ca. 100,700 DKK pr md
Område
Vesterbro, Copenhagen
Type
Office space
Land in Rotterdam Kralingen-Crooswijk, Rotterdam
 More info
Land in Rotterdam Kralingen-Crooswijk, Rotterdam
Grond te huur in Rotterdam Kralingen-Crooswijk, Rotterdam
Areal
Ca. 10 m2
Pris pr. md.
Ca. 400 EUR pr md
Område
Rotterdam Kralingen-Crooswijk, Rotterdam
Type
Land
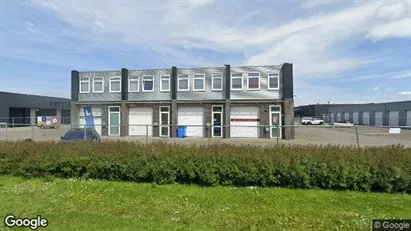
Commercial space in Dronten, Flevoland
 More info
Commercial space in Dronten, Flevoland
Commercial space for rent in Dronten, Flevoland
Areal
Ca. 100 m2
Pris pr. md.
Ca. 800 EUR pr md
Område
Dronten, Flevoland
Type
Commercial property
Commercial space in Roskilde, Greater Copenhagen
 More info
Commercial space in Roskilde, Greater Copenhagen
Commercial space for rent in Roskilde, Greater Copenhagen
Areal
Ca. 1,505 m2
Pris pr. md.
Ca. 69,050 DKK pr md
Område
Roskilde, Greater Copenhagen
Type
Commercial property
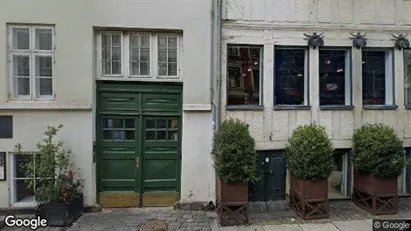
Office space in Copenhagen K, Copenhagen
 More info
Office space in Copenhagen K, Copenhagen
Office space for rent in Copenhagen K, Copenhagen
Areal
Ca. 110 m2
Pris pr. md.
Ca. 15,600 DKK pr md
Område
Copenhagen K, Copenhagen
Type
Office space
Office space in Bologna, Emilia-Romagna
 More info
Office space in Bologna, Emilia-Romagna
Office space for rent in Bologna, Emilia-Romagna
Areal
Ca. 240 m2
Pris pr. md.
Ca. 8,300 EUR pr md
Område
Bologna, Emilia-Romagna
Type
Office space
Office space in Amsterdam Centrum, Amsterdam
 More info
Office space in Amsterdam Centrum, Amsterdam
Office space for rent in Amsterdam Centrum, Amsterdam
Areal
Ca. 100 m2
Pris pr. md.
Not stated
Område
Amsterdam Centrum, Amsterdam
Type
Office space
Warehouse in London E8, Greater London
 More info
Warehouse in London E8, Greater London
Warehouse for rent in London E8, Greater London
Areal
Ca. 445 m2
Pris pr. md.
Ca. 7,100 GBP pr md
Område
London E8, Greater London
Type
Warehouse
Commercial space in Thessaloniki, Central Macedonia
 More info
Commercial space in Thessaloniki, Central Macedonia
Commercial space for rent in Thessaloniki, Central Macedonia
Areal
Ca. 55 m2
Pris pr. md.
Ca. 600 EUR pr md
Område
Thessaloniki, Central Macedonia
Type
Commercial property
Commercial space in Ostholstein, Schleswig-Holstein
 More info
Commercial space in Ostholstein, Schleswig-Holstein
Commercial space for rent in Ostholstein, Schleswig-Holstein
Areal
Ca. 50 m2
Pris pr. md.
Ca. 170,000 EUR pr md
Område
Ostholstein, Schleswig-Holstein
Type
Commercial property
Office space in Limassol, Limassol (Eparchies)
 More info
Office space in Limassol, Limassol (Eparchies)
Office space for rent in Limassol, Limassol (Eparchies)
Areal
Ca. 375 m2
Pris pr. md.
Ca. 8,000 EUR pr md
Område
Limassol, Limassol (Eparchies)
Type
Office space
Office space in Amsterdam Centrum, Amsterdam
 More info
Office space in Amsterdam Centrum, Amsterdam
Office space for rent in Amsterdam Centrum, Amsterdam
Areal
Ca. 110 m2
Pris pr. md.
Not stated
Område
Amsterdam Centrum, Amsterdam
Type
Office space
Office space in Vesterbro, Copenhagen
 More info
Office space in Vesterbro, Copenhagen
Office space for rent in Vesterbro, Copenhagen
Areal
Ca. 785 m2
Pris pr. md.
Ca. 124,300 DKK pr md
Område
Vesterbro, Copenhagen
Type
Office space
Office space in Dublin 14, Dublin
 More info
Office space in Dublin 14, Dublin
Office space for rent in Dublin 14, Dublin
Areal
Ca. 165 m2
Pris pr. md.
Ca. 3,000 EUR pr md
Område
Dublin 14, Dublin
Type
Office space
Selected customers
30,000 customers use Companyspace.com
30,000 customers
285,000 companies in our database
2,400 rentals annually
Companyspace.com is used by thousands of landlords, property companies, commercial real estate agents, investors and business centres seeking greater visibility, more enquiries and lower vacancy rates.


