Available office spaces in Belgium
See all available office spaces in Belgium below. If you are looking for office space in Belgium, you have come to the right place. We have most available office spaces in Belgium in our database. Find office space in Belgium here. Enjoy.
4,051 office spaces found
-
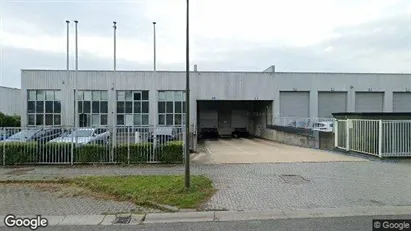
16000 m2 warehouse for rent in Charleroi, Henegouwen
- 40,000 EUR per month
- 30 EUR /m2/year
-
63 m2 office space for rent in Schilde, Antwerp (Province)
- 725 EUR per month
- 138.10 EUR /m2/year
-
280 m2 office space for rent in Stad Gent, Gent
- 1,400 EUR per month
- 60 EUR /m2/year
-
124 m2 office space for rent in Antwerp Deurne, Antwerp
- 1,100 EUR per month
- 106.45 EUR /m2/year
-
670 m2 office space for rent in Sint-Martens-Latem, Oost-Vlaanderen
- 6,700 EUR per month
- 120 EUR /m2/year
-
130 m2 office space for rent in Stad Antwerp, Antwerp
- 1,408 EUR per month
- 129.97 EUR /m2/year
-
430 m2 office space for rent in Stad Antwerp, Antwerp
- 4,975 EUR per month
- 138.84 EUR /m2/year
-
174 m2 office space for rent in Sint-Martens-Latem, Oost-Vlaanderen
- 1,813 EUR per month
- 125.03 EUR /m2/year
-
202 m2 office space for rent in Gent Sint-Denijs-Westrem, Gent
- 2,357 EUR per month
- 140.02 EUR /m2/year
-
1775 m2 office space for rent in Stad Antwerp, Antwerp
- 1,856 EUR per month
- 12.55 EUR /m2/year
-
485 m2 office space for rent in Stad Antwerp, Antwerp
- 5,052 EUR per month
- 125 EUR /m2/year
-
391 m2 office space for rent in Mechelen, Antwerp (Province)
- 3,063 EUR per month
- 94.01 EUR /m2/year
-
136 m2 office space for rent in Stad Antwerp, Antwerp
- 1,450 EUR per month
- 127.94 EUR /m2/year
-
2732 m2 office space for rent in Stad Antwerp, Antwerp
- 7,292 EUR per month
- 32.03 EUR /m2/year
-
588 m2 office space for rent in Antwerp Berchem, Antwerp
- 6,688 EUR per month
- 136.49 EUR /m2/year
Frequently asked questions
Statistics on the development of available office spaces for rent in Belgium over the past month
Also see aggregate statistics on all available office spaces in Belgium over time, aggregate statistics on new office spaces in Belgium over time, aggregate statistics on rented office spaces in Belgium over time
| Date | |||
|---|---|---|---|
| 13. January 2026 | 4034 | 252 | 212 |
| 12. January 2026 | 3994 | 136 | 0 |
| 11. January 2026 | 3858 | 115 | 244 |
| 10. January 2026 | 3987 | 78 | 0 |
| 9. January 2026 | 3909 | 85 | 161 |
| 8. January 2026 | 3985 | 184 | 203 |
| 7. January 2026 | 4004 | 102 | 0 |
| 6. January 2026 | 3902 | 228 | 34 |
| 5. January 2026 | 3708 | 52 | 98 |
| 4. January 2026 | 3754 | 7 | 2 |
| 3. January 2026 | 3749 | 116 | 111 |
| 2. January 2026 | 3744 | 61 | 7 |
| 1. January 2026 | 3690 | 15 | 98 |
| 31. December 2025 | 3773 | 8 | 11 |
| 30. December 2025 | 3776 | 86 | 91 |
| 29. December 2025 | 3781 | 261 | 0 |
| 28. December 2025 | 3520 | 110 | 112 |
| 27. December 2025 | 3522 | 26 | 0 |
| 26. December 2025 | 3496 | 68 | 141 |
| 25. December 2025 | 3569 | 41 | 0 |
| 24. December 2025 | 3528 | 96 | 955 |
| 23. December 2025 | 4387 | 70 | 0 |
| 22. December 2025 | 4317 | 44 | 116 |
| 21. December 2025 | 4389 | 103 | 0 |
| 20. December 2025 | 4286 | 26 | 102 |
| 19. December 2025 | 4362 | 66 | 72 |
| 18. December 2025 | 4368 | 41 | 4 |
| 17. December 2025 | 4331 | 68 | 55 |
| 16. December 2025 | 4318 | 113 | 156 |
| 15. December 2025 | 4361 | 29 | 43 |
| 14. December 2025 | 4375 | 18 | 0 |
Statistics on currently available office spaces in Belgium
Also see gathered statistics of all available office spaces over time, the gathered statistics of new office spaces over time, the gathered statistics of rented office spaces over time
| Office spaces | |
|---|---|
| Available premises | 4,047 |
| New premises since yesterday | 252 |
| Rented out premises since yesterday | 212 |
| Total available m2 | 3,888,397 |
| Average price per m2 per year without expenses | 49,458 |
| Highest price per m2 per year | 2,059,584 |
| Lowest price per m2 per year | 1.02 |


