


Office spacesin Henegouwen
See all available office spaces in Henegouwen below. If you are looking for office space in Henegouwen, you have come to the right place. We have most available office spaces in Henegouwen in our database. Find office space in Henegouwen here. Enjoy.
Companyspace.com today:
New today 1,055
Updated 24h 1,435
Notifications about new companyspaces2,179
Copenhagen +3
Stockholm +2
Amsterdam +11
Berlin +2
Brussels +8
Vienna +33
Dublin (county) +29
Warsaw +9
Lisbon +1
Latest update 1 min ago
Active ads 358,707
241 office spaces found
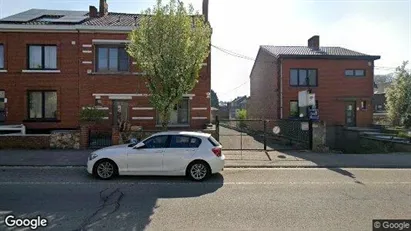
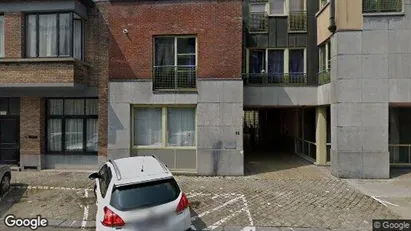
Office property in Doornik, Henegouwen
 More info
Office property in Doornik, Henegouwen
Office space for sale in Doornik, Henegouwen
Areal
Ca. 240 m2
Pris
Ca. 390,000EUR
Område
Doornik, Henegouwen
Type
Office space
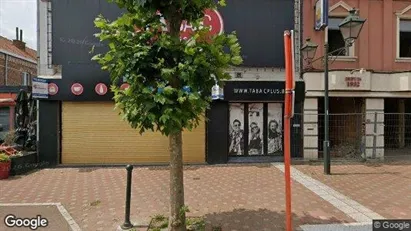
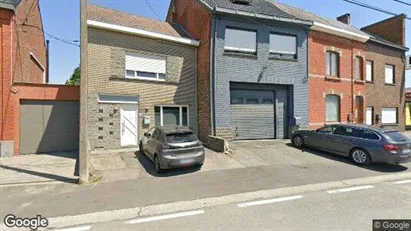
Office space in Doornik, Henegouwen
 More info
Office space in Doornik, Henegouwen
Office space for rent in Doornik, Henegouwen
Areal
-
Pris pr. md.
Ca. 2,200 EUR pr md
Område
Doornik, Henegouwen
Type
Office space
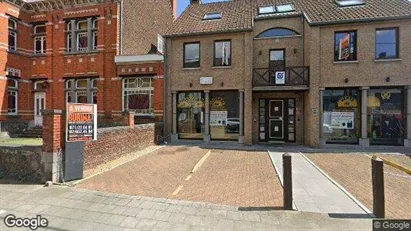
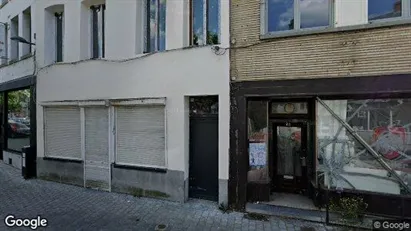
Office property in La Louvière, Henegouwen
 More info
Office property in La Louvière, Henegouwen
Office space for sale in La Louvière, Henegouwen
Areal
Ca. 775 m2
Pris
Ca. 549,000EUR
Område
La Louvière, Henegouwen
Type
Office space
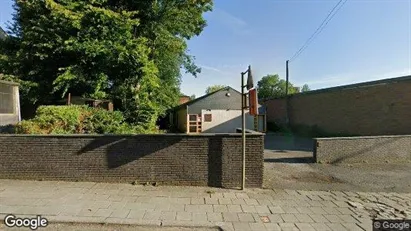
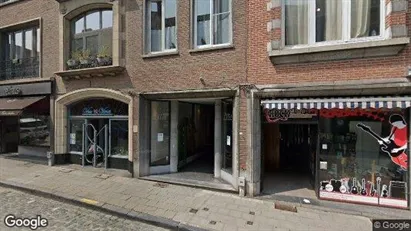
Office property in Komen-Waasten, Henegouwen
 More info
Office property in Komen-Waasten, Henegouwen
Office space for sale in Komen-Waasten, Henegouwen
Areal
Ca. 180 m2
Pris
Ca. 250,000EUR
Område
Komen-Waasten, Henegouwen
Type
Office space
Office property in Erquelinnes, Henegouwen
 More info
Office property in Erquelinnes, Henegouwen
Office space for sale in Erquelinnes, Henegouwen
Areal
Ca. 335 m2
Pris
Ca. 480,000EUR
Område
Erquelinnes, Henegouwen
Type
Office space
Office property in Pecq, Henegouwen
 More info
Office property in Pecq, Henegouwen
Office space for sale in Pecq, Henegouwen
Areal
Ca. 300 m2
Pris
Ca. 450,000EUR
Område
Pecq, Henegouwen
Type
Office space
Office property in Charleroi, Henegouwen
 More info
Office property in Charleroi, Henegouwen
Office space for sale in Charleroi, Henegouwen
Areal
Ca. 200 m2
Pris
Ca. 209,000EUR
Område
Charleroi, Henegouwen
Type
Office space
Office property in Doornik, Henegouwen
 More info
Office property in Doornik, Henegouwen
Office space for sale in Doornik, Henegouwen
Areal
Ca. 1,000 m2
Pris
Ca. 499,000EUR
Område
Doornik, Henegouwen
Type
Office space
Office space in Charleroi, Henegouwen
 More info
Office space in Charleroi, Henegouwen
Office space for rent in Charleroi, Henegouwen
Areal
Ca. 1,415 m2
Pris pr. md.
Ca. 16,500 EUR pr md
Område
Charleroi, Henegouwen
Type
Office space
Office property in Colfontaine, Henegouwen
 More info
Office property in Colfontaine, Henegouwen
Office space for sale in Colfontaine, Henegouwen
Areal
Ca. 255 m2
Pris
Ca. 270,000EUR
Område
Colfontaine, Henegouwen
Type
Office space
Office property in La Louvière, Henegouwen
 More info
Office property in La Louvière, Henegouwen
Office space for sale in La Louvière, Henegouwen
Areal
Ca. 205 m2
Pris
Ca. 150,000EUR
Område
La Louvière, Henegouwen
Type
Office space
Office property in Frameries, Henegouwen
 More info
Office property in Frameries, Henegouwen
Office space for sale in Frameries, Henegouwen
Areal
Ca. 1,680 m2
Pris
Ca. 475,000EUR
Område
Frameries, Henegouwen
Type
Office space
Office property in Binche, Henegouwen
 More info
Office property in Binche, Henegouwen
Office space for sale in Binche, Henegouwen
Areal
Ca. 125 m2
Pris
Ca. 215,000EUR
Område
Binche, Henegouwen
Type
Office space
Office property in Doornik, Henegouwen
 More info
Office property in Doornik, Henegouwen
Office space for sale in Doornik, Henegouwen
Areal
Ca. 90 m2
Pris
Ca. 170,000EUR
Område
Doornik, Henegouwen
Type
Office space
Office property in Aat, Henegouwen
 More info
Office property in Aat, Henegouwen
Office space for sale in Aat, Henegouwen
Areal
Ca. 120 m2
Pris
Ca. 225,000EUR
Område
Aat, Henegouwen
Type
Office space
Office property in Péruwelz, Henegouwen
 More info
Office property in Péruwelz, Henegouwen
Office space for sale in Péruwelz, Henegouwen
Areal
Ca. 800 m2
Pris
Ca. 499,000EUR
Område
Péruwelz, Henegouwen
Type
Office space
Office property in Doornik, Henegouwen
 More info
Office property in Doornik, Henegouwen
Office space for sale in Doornik, Henegouwen
Areal
Ca. 205 m2
Pris
Ca. 390,000EUR
Område
Doornik, Henegouwen
Type
Office space
Office space in La Louvière, Henegouwen
 More info
Office space in La Louvière, Henegouwen
Office space for rent in La Louvière, Henegouwen
Areal
-
Pris pr. md.
Ca. 500 EUR pr md
Område
La Louvière, Henegouwen
Type
Office space
Selected customers
30,000 customers use Companyspace.com
30,000 customers
285,000 companies in our database
2,400 rentals annually
Companyspace.com is used by thousands of landlords, property companies, commercial real estate agents, investors and business centres seeking greater visibility, more enquiries and lower vacancy rates.


