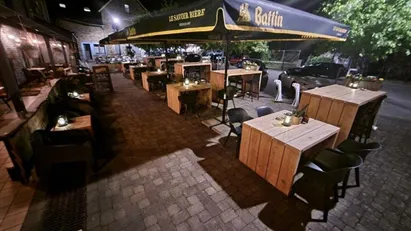
Available restaurant locations in Belgium
See available restaurant locations, restaurant spaces and restaurant properties in all of Belgium below. If you are looking for available premises for café or restaurant in Belgium, you have come to the right place. We have most available restaurant spaces and restaurant properties in Belgium in our database. Find your restaurant space in Belgium here. Enjoy. More info about restaurant locations in Belgium.
-
Ca. 550 m2 restaurant for rent in Brugge, West-Vlaanderen
- Ca. 4,500 EUR per month
- Ca. 100 EUR /m2/year
-
Ca. 275 m2 restaurant for rent in Brugge, West-Vlaanderen
- Ca. 6,000 EUR per month
- Ca. 250 EUR /m2/year
-
Ca. 370 m2 restaurant for rent in Stad Antwerp, Antwerp
- Ca. 6,750 EUR per month
- Ca. 200 EUR /m2/year
-
Ca. 180 m2 restaurant for rent in Stad Antwerp, Antwerp
- Ca. 5,000 EUR per month
- Ca. 350 EUR /m2/year
-
Ca. 240 m2 restaurant for rent in Stad Antwerp, Antwerp
- Ca. 6,500 EUR per month
- Ca. 350 EUR /m2/year
Frequently asked questions
Statistics on the development of available restaurants for rent in Belgium over the past month
Also see aggregate statistics on all available restaurants in Belgium over time, aggregate statistics on new restaurants in Belgium over time, aggregate statistics on rented restaurants in Belgium over time
| Date | |||
|---|---|---|---|
| 11. February 2026 | 168 | 3 | 3 |
| 10. February 2026 | 168 | 3 | 1 |
| 9. February 2026 | 166 | 1 | 1 |
| 8. February 2026 | 166 | 0 | 0 |
| 7. February 2026 | 166 | 0 | 1 |
| 6. February 2026 | 167 | 2 | 0 |
| 5. February 2026 | 165 | 4 | 4 |
| 4. February 2026 | 165 | 3 | 7 |
| 3. February 2026 | 169 | 6 | 0 |
| 2. February 2026 | 163 | 3 | 4 |
| 1. February 2026 | 164 | 6 | 5 |
| 31. January 2026 | 163 | 6 | 0 |
| 30. January 2026 | 157 | 1 | 2 |
| 29. January 2026 | 158 | 4 | 3 |
| 28. January 2026 | 157 | 3 | 0 |
| 27. January 2026 | 154 | 4 | 4 |
| 26. January 2026 | 154 | 1 | 0 |
| 25. January 2026 | 153 | 0 | 0 |
| 24. January 2026 | 153 | 3 | 2 |
| 23. January 2026 | 152 | 2 | 1 |
| 22. January 2026 | 151 | 3 | 0 |
| 21. January 2026 | 148 | 2 | 0 |
| 20. January 2026 | 146 | 2 | 0 |
| 19. January 2026 | 144 | 0 | 0 |
| 18. January 2026 | 144 | 2 | 2 |
| 17. January 2026 | 144 | 3 | 2 |
| 16. January 2026 | 143 | 2 | 1 |
| 15. January 2026 | 142 | 1 | 0 |
| 14. January 2026 | 141 | 6 | 6 |
| 13. January 2026 | 141 | 5 | 0 |
| 12. January 2026 | 136 | 1 | 0 |
Statistics on currently available restaurants in Belgium
Also see gathered statistics of all available restaurants over time, the gathered statistics of new restaurants over time, the gathered statistics of rented restaurants over time
| Restaurants | |
|---|---|
| Available premises | 171 |
| New premises since yesterday | 3 |
| Rented out premises since yesterday | 3 |
| Total available m2 | 169,004 |
| Average price per m2 per year without expenses | 236 |
| Highest price per m2 per year | 2,600 |
| Lowest price per m2 per year | 2.33 |


