


Office spacesin Vlaams-Brabant
See all available office spaces in Vlaams-Brabant below. If you are looking for office space in Vlaams-Brabant, you have come to the right place. We have most available office spaces in Vlaams-Brabant in our database. Find office space in Vlaams-Brabant here. Enjoy.
Companyspace.com today:
New today 1,105
Updated 24h 1,163
Notifications about new companyspaces1,891
Copenhagen +25
Amsterdam +15
Berlin +4
Brussels +9
Vienna +71
Paris +5
Madrid +3
Dublin (county) +10
Warsaw +23
Lisbon +1
Latest update 4 min ago
Active ads 365,102
1,289 office spaces found
Restaurant in Leuven, Vlaams-Brabant
 More info
Restaurant in Leuven, Vlaams-Brabant
Deze is 9 j een frituur geweest heeft nu wel wat opknap werk nodig waar ik als verhuurder wel wil instaan voor keuring eletriciteit en verwarming
Areal
Ca. 55 m2
Pris pr. md.
Ca. 100 EUR pr md
Område
Leuven, Vlaams-Brabant
Type
Restaurant
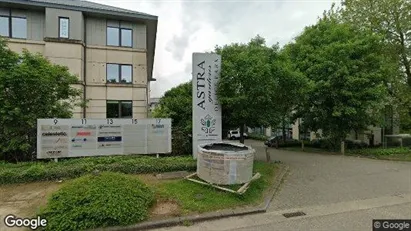
Office space in Leuven, Vlaams-Brabant
 More info
Office space in Leuven, Vlaams-Brabant
Office space for rent in Leuven, Vlaams-Brabant
Areal
Ca. 350 m2
Pris pr. md.
Ca. 4,550 EUR pr md
Område
Leuven, Vlaams-Brabant
Type
Office space
Office space in Dilbeek, Vlaams-Brabant
 More info
Office space in Dilbeek, Vlaams-Brabant
Office space for rent in Dilbeek, Vlaams-Brabant
Areal
Ca. 10 m2
Pris pr. md.
Ca. 150 EUR pr md
Område
Dilbeek, Vlaams-Brabant
Type
Office space
Office space in Leuven, Vlaams-Brabant
 More info
Office space in Leuven, Vlaams-Brabant
Office space for rent in Leuven, Vlaams-Brabant
Areal
Ca. 865 m2
Pris pr. md.
Ca. 5,650 EUR pr md
Område
Leuven, Vlaams-Brabant
Type
Office space
Office space in Dilbeek, Vlaams-Brabant
 More info
Office space in Dilbeek, Vlaams-Brabant
Office space for rent in Dilbeek, Vlaams-Brabant
Areal
Ca. 5 m2
Pris pr. md.
Ca. 300 EUR pr md
Område
Dilbeek, Vlaams-Brabant
Type
Office space
Office space in Machelen, Vlaams-Brabant
 More info
Office space in Machelen, Vlaams-Brabant
Office space for rent in Machelen, Vlaams-Brabant
Areal
270 - 1,061 m2
Pris pr. md.
Ca. 2,500 EUR pr md
Område
Machelen, Vlaams-Brabant
Type
Office space
Office space in Leuven, Vlaams-Brabant
 More info
Office space in Leuven, Vlaams-Brabant
Office space for rent in Leuven, Vlaams-Brabant
Areal
Ca. 350 m2
Pris pr. md.
Ca. 4,400 EUR pr md
Område
Leuven, Vlaams-Brabant
Type
Office space
Office space in Zaventem, Vlaams-Brabant
 More info
Office space in Zaventem, Vlaams-Brabant
Office space for rent in Zaventem, Vlaams-Brabant
Areal
Ca. 590 m2
Pris pr. md.
Ca. 4,450 EUR pr md
Område
Zaventem, Vlaams-Brabant
Type
Office space
Office space in Leuven, Vlaams-Brabant
 More info
Office space in Leuven, Vlaams-Brabant
Office space for rent in Leuven, Vlaams-Brabant
Areal
Ca. 105 m2
Pris pr. md.
Ca. 1,350 EUR pr md
Område
Leuven, Vlaams-Brabant
Type
Office space
Office space in Leuven, Vlaams-Brabant
 More info
Office space in Leuven, Vlaams-Brabant
Office space for rent in Leuven, Vlaams-Brabant
Areal
Ca. 175 m2
Pris pr. md.
Ca. 1,600 EUR pr md
Område
Leuven, Vlaams-Brabant
Type
Office space
Office space in Machelen, Vlaams-Brabant
 More info
Office space in Machelen, Vlaams-Brabant
Office space for rent in Machelen, Vlaams-Brabant
Areal
Ca. 390 m2
Pris pr. md.
Ca. 3,750 EUR pr md
Område
Machelen, Vlaams-Brabant
Type
Office space
Office space in Leuven, Vlaams-Brabant
 More info
Office space in Leuven, Vlaams-Brabant
Office space for rent in Leuven, Vlaams-Brabant
Areal
Ca. 950 m2
Pris pr. md.
Ca. 11,800 EUR pr md
Område
Leuven, Vlaams-Brabant
Type
Office space
Office space in Drogenbos, Vlaams-Brabant
 More info
Office space in Drogenbos, Vlaams-Brabant
Office space for rent in Drogenbos, Vlaams-Brabant
Areal
Ca. 455 m2
Pris pr. md.
Ca. 3,800 EUR pr md
Område
Drogenbos, Vlaams-Brabant
Type
Office space
Office space in Machelen, Vlaams-Brabant
 More info
Office space in Machelen, Vlaams-Brabant
Office space for rent in Machelen, Vlaams-Brabant
Areal
Ca. 1,005 m2
Pris pr. md.
Ca. 9,650 EUR pr md
Område
Machelen, Vlaams-Brabant
Type
Office space
Office space in Machelen, Vlaams-Brabant
 More info
Office space in Machelen, Vlaams-Brabant
Office space for rent in Machelen, Vlaams-Brabant
Areal
Ca. 910 m2
Pris pr. md.
Ca. 9,100 EUR pr md
Område
Machelen, Vlaams-Brabant
Type
Office space
Office space in Zaventem, Vlaams-Brabant
 More info
Office space in Zaventem, Vlaams-Brabant
Office space for rent in Zaventem, Vlaams-Brabant
Areal
Ca. 590 m2
Pris pr. md.
Ca. 4,700 EUR pr md
Område
Zaventem, Vlaams-Brabant
Type
Office space
Office space in Leuven, Vlaams-Brabant
 More info
Office space in Leuven, Vlaams-Brabant
Office space for rent in Leuven, Vlaams-Brabant
Areal
Ca. 335 m2
Pris pr. md.
Ca. 5,350 EUR pr md
Område
Leuven, Vlaams-Brabant
Type
Office space
Office space in Leuven, Vlaams-Brabant
 More info
Office space in Leuven, Vlaams-Brabant
Office space for rent in Leuven, Vlaams-Brabant
Areal
Ca. 600 m2
Pris pr. md.
Ca. 7,500 EUR pr md
Område
Leuven, Vlaams-Brabant
Type
Office space
Selected customers
30,000 customers use Companyspace.com
30,000 customers
285,000 companies in our database
2,400 rentals annually
Companyspace.com is used by thousands of landlords, property companies, commercial real estate agents, investors and business centres seeking greater visibility, more enquiries and lower vacancy rates.


