Available office spaces in Belgium
See all available office spaces in Belgium below. If you are looking for office space in Belgium, you have come to the right place. We have most available office spaces in Belgium in our database. Find office space in Belgium here. Enjoy.
5,190 office spaces found
-
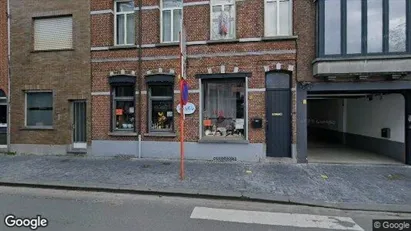
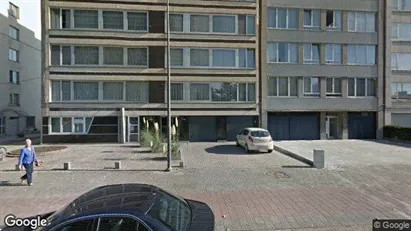
Ca. 210 m2 office space for rent in Kruibeke, Oost-Vlaanderen
- Ca. 2,200 EUR per month
- Ca. 150 EUR /m2/year
-
Ca. 120 m2 office space for rent in Stad Gent, Gent
- Ca. 150 EUR per month
- Ca. 50 EUR /m2/year
-
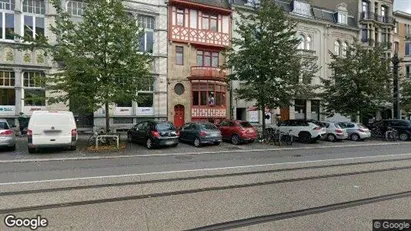
Ca. 235 m2 office space for rent in Stad Gent, Gent
- Ca. 200 EUR per month
- Ca. 50 EUR /m2/year
-
Ca. 20 m2 office space for rent in Stad Gent, Gent
- Ca. 50 EUR per month
- Ca. 50 EUR /m2/year
-
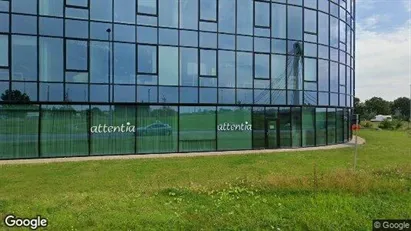
Ca. 750 m2 office space for rent in Gent Zwijnaarde, Gent
- Ca. 9,700 EUR per month
- Ca. 150 EUR /m2/year
-
Ca. 585 m2 office space for rent in Stad Gent, Gent
- Ca. 8,550 EUR per month
- Ca. 150 EUR /m2/year
-
Ca. 215 m2 office space for rent in Roeselare, West-Vlaanderen
- Ca. 2,550 EUR per month
- Ca. 150 EUR /m2/year
-
Ca. 130 m2 office space for rent in Antwerp Deurne, Antwerp
- Ca. 1,300 EUR per month
- Ca. 100 EUR /m2/year
Frequently asked questions
Statistics on the development of available office spaces for rent in Belgium over the past month
Also see aggregate statistics on all available office spaces in Belgium over time, aggregate statistics on new office spaces in Belgium over time, aggregate statistics on rented office spaces in Belgium over time
| Date | |||
|---|---|---|---|
| 2. February 2026 | 3962 | 72 | 68 |
| 1. February 2026 | 3958 | 22 | 31 |
| 31. January 2026 | 3967 | 131 | 117 |
| 30. January 2026 | 3953 | 61 | 83 |
| 29. January 2026 | 3975 | 107 | 99 |
| 28. January 2026 | 3967 | 54 | 8 |
| 27. January 2026 | 3921 | 72 | 66 |
| 26. January 2026 | 3915 | 23 | 71 |
| 25. January 2026 | 3963 | 44 | 13 |
| 24. January 2026 | 3932 | 34 | 43 |
| 23. January 2026 | 3941 | 63 | 73 |
| 22. January 2026 | 3951 | 159 | 118 |
| 21. January 2026 | 3910 | 21 | 84 |
| 20. January 2026 | 3973 | 78 | 96 |
| 19. January 2026 | 3991 | 25 | 89 |
| 18. January 2026 | 4055 | 94 | 77 |
| 17. January 2026 | 4038 | 15 | 20 |
| 16. January 2026 | 4043 | 376 | 358 |
| 15. January 2026 | 4025 | 24 | 44 |
| 14. January 2026 | 4045 | 130 | 119 |
| 13. January 2026 | 4034 | 252 | 212 |
| 12. January 2026 | 3994 | 136 | 0 |
| 11. January 2026 | 3858 | 115 | 244 |
| 10. January 2026 | 3987 | 78 | 0 |
| 9. January 2026 | 3909 | 85 | 161 |
| 8. January 2026 | 3985 | 184 | 203 |
| 7. January 2026 | 4004 | 102 | 0 |
| 6. January 2026 | 3902 | 228 | 34 |
| 5. January 2026 | 3708 | 52 | 98 |
| 4. January 2026 | 3754 | 7 | 2 |
| 3. January 2026 | 3749 | 116 | 0 |
Statistics on currently available office spaces in Belgium
Also see gathered statistics of all available office spaces over time, the gathered statistics of new office spaces over time, the gathered statistics of rented office spaces over time
| Office spaces | |
|---|---|
| Available premises | 3,978 |
| New premises since yesterday | 72 |
| Rented out premises since yesterday | 68 |
| Total available m2 | 3,332,460 |
| Average price per m2 per year without expenses | 61,865 |
| Highest price per m2 per year | 2,938,656 |
| Lowest price per m2 per year | 1.02 |


