


Industrial properties in Colmenarejo
These commercial premises are closest to your search
We currently have no available commercial premises registered that match your search exactly. Therefore, we show below the commercial premises that best match your search based on the current market.
The shown listings may differ from your original search in terms of, for example, premises type, location, size or price, but they have been selected because they may be relevant alternatives for your business.
Take a look at the suggestions below – or start your search again here.
Companyspace.com today:
New today 925
Updated 24h 995
Notifications about new companyspaces2,006
Copenhagen +10
Stockholm +4
Amsterdam +27
Brussels +20
Vienna +33
Dublin (county) +15
Warsaw +9
Latest update 2 h ago
Active ads 365,310
Office space in Villaviciosa de Odón, Comunidad de Madrid
 More info
Office space in Villaviciosa de Odón, Comunidad de Madrid
Office space for rent in Villaviciosa de Odón, Comunidad de Madrid
Areal
-
Pris pr. md.
Ca. 3,000 EUR pr md
Område
Villaviciosa de Odón, Comunidad de Madrid
Type
Office space
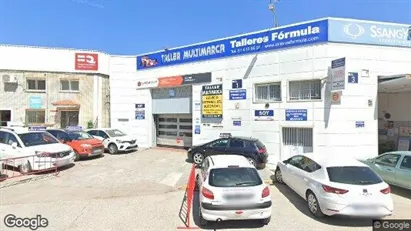
Industrial property in Villaviciosa de Odón, Comunidad de Madrid
 More info
Industrial property in Villaviciosa de Odón, Comunidad de Madrid
Industrial property for rent in Villaviciosa de Odón, Comunidad de Madrid
Areal
-
Pris pr. md.
Ca. 12,500 EUR pr md
Område
Villaviciosa de Odón, Comunidad de Madrid
Type
Industrial property
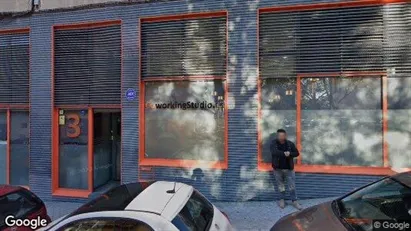
Commercial space in Madrid Arganzuela, Madrid
 More info
Commercial space in Madrid Arganzuela, Madrid
Commercial space for rent in Madrid Arganzuela, Madrid
Areal
Ca. 150 m2
Pris pr. md.
Ca. 200 EUR pr md
Område
Madrid Arganzuela, Madrid
Type
Commercial property
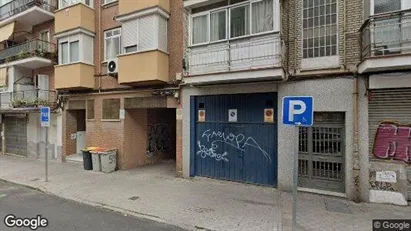
Commercial space in Madrid Centro, Madrid
 More info
Commercial space in Madrid Centro, Madrid
Commercial space for rent in Madrid Centro, Madrid
Areal
Ca. 100 m2
Pris pr. md.
Ca. 200 EUR pr md
Område
Madrid Centro, Madrid
Type
Commercial property
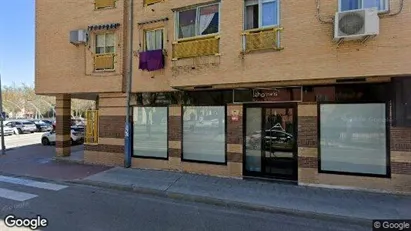
Commercial space in Madrid Retiro, Madrid
 More info
Commercial space in Madrid Retiro, Madrid
Commercial space for rent in Madrid Retiro, Madrid
Areal
Ca. 215 m2
Pris pr. md.
Ca. 250 EUR pr md
Område
Madrid Retiro, Madrid
Type
Commercial property
Commercial space in Madrid Tetuán, Madrid
 More info
Commercial space in Madrid Tetuán, Madrid
Commercial space for rent in Madrid Tetuán, Madrid
Areal
Ca. 25 m2
Pris pr. md.
Ca. 100 EUR pr md
Område
Madrid Tetuán, Madrid
Type
Commercial property
Commercial space in Madrid Ciudad Lineal, Madrid
 More info
Commercial space in Madrid Ciudad Lineal, Madrid
Commercial space for rent in Madrid Ciudad Lineal, Madrid
Areal
Ca. 5 m2
Pris pr. md.
Ca. 500 EUR pr md
Område
Madrid Ciudad Lineal, Madrid
Type
Commercial property
Warehouse property in Madrid Ciudad Lineal, Madrid
 More info
Warehouse property in Madrid Ciudad Lineal, Madrid
Warehouse for sale in Madrid Ciudad Lineal, Madrid
Areal
-
Pris
Ca. 391,000EUR
Område
Madrid Ciudad Lineal, Madrid
Type
Warehouse
Industrial property in Meco, Comunidad de Madrid
 More info
Industrial property in Meco, Comunidad de Madrid
Industrial property for sale in Meco, Comunidad de Madrid
Areal
-
Pris
Ca. 236,000EUR
Område
Meco, Comunidad de Madrid
Type
Industrial property
Office property in Collado Villalba, Comunidad de Madrid
 More info
Office property in Collado Villalba, Comunidad de Madrid
Office space for sale in Collado Villalba, Comunidad de Madrid
Areal
-
Pris
Ca. 149,000EUR
Område
Collado Villalba, Comunidad de Madrid
Type
Office space
Industrial property in San Sebastián de los Reyes, Comunidad de Madrid
 More info
Industrial property in San Sebastián de los Reyes, Comunidad de Madrid
Industrial property for sale in San Sebastián de los Reyes, Comunidad de Madrid
Areal
-
Pris
Ca. 425,000EUR
Område
San Sebastián de los Reyes, Comunidad de Madrid
Type
Industrial property
Industrial property in Fuenlabrada, Comunidad de Madrid
 More info
Industrial property in Fuenlabrada, Comunidad de Madrid
Industrial property for rent in Fuenlabrada, Comunidad de Madrid
Areal
-
Pris pr. md.
Ca. 8,500 EUR pr md
Område
Fuenlabrada, Comunidad de Madrid
Type
Industrial property
Office property in Pinto, Comunidad de Madrid
 More info
Office property in Pinto, Comunidad de Madrid
Office space for sale in Pinto, Comunidad de Madrid
Areal
-
Pris
Ca. 285,000EUR
Område
Pinto, Comunidad de Madrid
Type
Office space
Industrial property in Fuenlabrada, Comunidad de Madrid
 More info
Industrial property in Fuenlabrada, Comunidad de Madrid
Industrial property for sale in Fuenlabrada, Comunidad de Madrid
Areal
-
Pris
Ca. 695,000EUR
Område
Fuenlabrada, Comunidad de Madrid
Type
Industrial property
Commercial property in Madrid Carabanchel, Madrid
 More info
Commercial property in Madrid Carabanchel, Madrid
Commercial property for sale in Madrid Carabanchel, Madrid
Areal
-
Pris
Ca. 115,000EUR
Område
Madrid Carabanchel, Madrid
Type
Commercial property
Office space in Tres Cantos, Comunidad de Madrid
 More info
Office space in Tres Cantos, Comunidad de Madrid
Office space for rent in Tres Cantos, Comunidad de Madrid
Areal
-
Pris pr. md.
Ca. 15,100 EUR pr md
Område
Tres Cantos, Comunidad de Madrid
Type
Office space
Office property in Collado Villalba, Comunidad de Madrid
 More info
Office property in Collado Villalba, Comunidad de Madrid
Office space for sale in Collado Villalba, Comunidad de Madrid
Areal
-
Pris
Ca. 85,000EUR
Område
Collado Villalba, Comunidad de Madrid
Type
Office space
Industrial property in Pinto, Comunidad de Madrid
 More info
Industrial property in Pinto, Comunidad de Madrid
Industrial property for rent in Pinto, Comunidad de Madrid
Areal
-
Pris pr. md.
Ca. 7,900 EUR pr md
Område
Pinto, Comunidad de Madrid
Type
Industrial property
Selected customers
30,000 customers use Companyspace.com
30,000 customers
285,000 companies in our database
2,400 rentals annually
Companyspace.com is used by thousands of landlords, property companies, commercial real estate agents, investors and business centres seeking greater visibility, more enquiries and lower vacancy rates.


