


Industrial propertiesin Comunidad de Madrid
See all available industrial properties in Comunidad de Madrid below. If you are looking for industrial property in Comunidad de Madrid, you have come to the right place. We have most available industrial properties in Comunidad de Madrid in our database. Find industrial property in Comunidad de Madrid here. Enjoy.
Companyspace.com today:
Updated 24h 1,800
Latest update 11 min ago
Active ads 365,142
202 industrial properties found
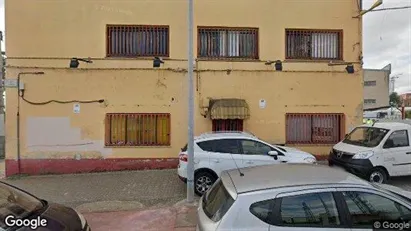
Industrial property in Pinto, Comunidad de Madrid
 More info
Industrial property in Pinto, Comunidad de Madrid
Industrial property for rent in Pinto, Comunidad de Madrid
Areal
-
Pris pr. md.
Ca. 7,900 EUR per month
Område
Pinto, Comunidad de Madrid
Type
Industrial property
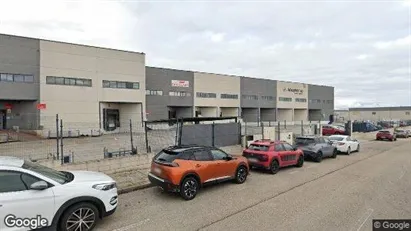
Industrial property in Ciempozuelos, Comunidad de Madrid
 More info
Industrial property in Ciempozuelos, Comunidad de Madrid
Industrial property for rent in Ciempozuelos, Comunidad de Madrid
Areal
-
Pris pr. md.
Ca. 1,800 EUR per month
Område
Ciempozuelos, Comunidad de Madrid
Type
Industrial property
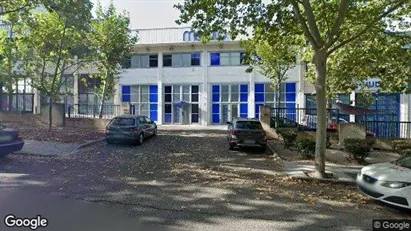
Industrial property in San Sebastián de los Reyes, Comunidad de Madrid
 More info
Industrial property in San Sebastián de los Reyes, Comunidad de Madrid
Industrial property for sale in San Sebastián de los Reyes, Comunidad de Madrid
Areal
-
Pris
Ca. 599,000EUR
Område
San Sebastián de los Reyes, Comunidad de Madrid
Type
Industrial property
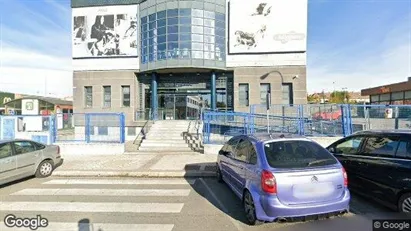
Industrial property in Villaviciosa de Odón, Comunidad de Madrid
 More info
Industrial property in Villaviciosa de Odón, Comunidad de Madrid
Industrial property for rent in Villaviciosa de Odón, Comunidad de Madrid
Areal
-
Pris pr. md.
Ca. 12,500 EUR per month
Område
Villaviciosa de Odón, Comunidad de Madrid
Type
Industrial property
Industrial property in Coslada, Comunidad de Madrid
 More info
Industrial property in Coslada, Comunidad de Madrid
Industrial property for rent in Coslada, Comunidad de Madrid
Areal
Ca. 2,500 m2
Pris pr. md.
Ca. 9,000 EUR per month
Område
Coslada, Comunidad de Madrid
Type
Industrial property
Industrial property in Alcobendas, Comunidad de Madrid
 More info
Industrial property in Alcobendas, Comunidad de Madrid
Industrial property for rent in Alcobendas, Comunidad de Madrid
Areal
Ca. 1,035 m2
Pris pr. md.
Ca. 6,750 EUR per month
Område
Alcobendas, Comunidad de Madrid
Type
Industrial property
Industrial property in Alcobendas, Comunidad de Madrid
 More info
Industrial property in Alcobendas, Comunidad de Madrid
Industrial property for rent in Alcobendas, Comunidad de Madrid
Areal
Ca. 1,910 m2
Pris pr. md.
Ca. 13,350 EUR per month
Område
Alcobendas, Comunidad de Madrid
Type
Industrial property
Industrial property in Humanes de Madrid, Comunidad de Madrid
 More info
Industrial property in Humanes de Madrid, Comunidad de Madrid
Industrial property for rent in Humanes de Madrid, Comunidad de Madrid
Areal
Ca. 800 m2
Pris pr. md.
Ca. 4,000 EUR per month
Område
Humanes de Madrid, Comunidad de Madrid
Type
Industrial property
Industrial property in Alcobendas, Comunidad de Madrid
 More info
Industrial property in Alcobendas, Comunidad de Madrid
Industrial property for rent in Alcobendas, Comunidad de Madrid
Areal
Ca. 1,915 m2
Pris pr. md.
Ca. 13,400 EUR per month
Område
Alcobendas, Comunidad de Madrid
Type
Industrial property
Industrial property in Alcorcón, Comunidad de Madrid
 More info
Industrial property in Alcorcón, Comunidad de Madrid
Industrial property for rent in Alcorcón, Comunidad de Madrid
Areal
-
Pris pr. md.
Ca. 5,800 EUR per month
Område
Alcorcón, Comunidad de Madrid
Type
Industrial property
Industrial property in Coslada, Comunidad de Madrid
More info
Industrial property in Coslada, Comunidad de Madrid
Industrial property for rent in Coslada, Comunidad de Madrid
Areal
Ca. 1,105 m2
Pris pr. md.
Ca. 7,200 EUR per month
Område
Coslada, Comunidad de Madrid
Type
Industrial property
Industrial property in Camarma de Esteruelas, Comunidad de Madrid
More info
Industrial property in Camarma de Esteruelas, Comunidad de Madrid
Industrial property for rent in Camarma de Esteruelas, Comunidad de Madrid
Areal
Ca. 10 m2
Pris pr. md.
Not stated
Område
Camarma de Esteruelas, Comunidad de Madrid
Type
Industrial property
Industrial property in San Sebastián de los Reyes, Comunidad de Madrid
More info
Industrial property in San Sebastián de los Reyes, Comunidad de Madrid
Industrial property for rent in San Sebastián de los Reyes, Comunidad de Madrid
Areal
Ca. 505 m2
Pris pr. md.
Ca. 4,500 EUR per month
Område
San Sebastián de los Reyes, Comunidad de Madrid
Type
Industrial property
Industrial property in San Sebastián de los Reyes, Comunidad de Madrid
More info
Industrial property in San Sebastián de los Reyes, Comunidad de Madrid
Industrial property for rent in San Sebastián de los Reyes, Comunidad de Madrid
Areal
Ca. 4,600 m2
Pris pr. md.
Ca. 16,500 EUR per month
Område
San Sebastián de los Reyes, Comunidad de Madrid
Type
Industrial property
Industrial property in Alcobendas, Comunidad de Madrid
More info
Industrial property in Alcobendas, Comunidad de Madrid
Industrial property for rent in Alcobendas, Comunidad de Madrid
Areal
Ca. 1,420 m2
Pris pr. md.
Ca. 10,650 EUR per month
Område
Alcobendas, Comunidad de Madrid
Type
Industrial property
Industrial property in San Fernando de Henares, Comunidad de Madrid
More info
Industrial property in San Fernando de Henares, Comunidad de Madrid
Industrial property for rent in San Fernando de Henares, Comunidad de Madrid
Areal
Ca. 5 m2
Pris pr. md.
Not stated
Område
San Fernando de Henares, Comunidad de Madrid
Type
Industrial property
Industrial property in Alcalá de Henares, Comunidad de Madrid
More info
Industrial property in Alcalá de Henares, Comunidad de Madrid
Industrial property for rent in Alcalá de Henares, Comunidad de Madrid
Areal
Ca. 930 m2
Pris pr. md.
Ca. 4,500 EUR per month
Område
Alcalá de Henares, Comunidad de Madrid
Type
Industrial property
Industrial property in Coslada, Comunidad de Madrid
More info
Industrial property in Coslada, Comunidad de Madrid
Industrial property for sale in Coslada, Comunidad de Madrid
Areal
Ca. 1,250 m2
Pris
Ca. 1,800,000EUR
Område
Coslada, Comunidad de Madrid
Type
Industrial property
Selected customers


