


Industrial property for rent in Colmenarejo
These commercial premises are closest to your search
We currently have no available commercial premises registered that match your search exactly. Therefore, we show below the commercial premises that best match your search based on the current market.
The shown listings may differ from your original search in terms of, for example, premises type, location, size or price, but they have been selected because they may be relevant alternatives for your business.
Take a look at the suggestions below – or start your search again here.
Companyspace.com today:
New today 802
Updated 24h 1,026
Notifications about new companyspaces1,525
Copenhagen +2
Stockholm +1
Amsterdam +5
Berlin +7
Brussels +2
Vienna +28
Paris +3
Dublin (county) +7
Warsaw +16
Roma (region) +3
Lisbon +1
Latest update 1 h ago
Active ads 365,511
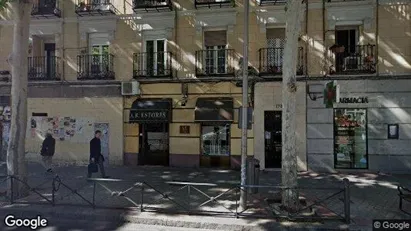
Commercial property in Madrid Retiro, Madrid
 More info
Commercial property in Madrid Retiro, Madrid
Commercial property En venta en Madrid Retiro, Madrid
Areal
Ca. 60 m2
Pris
Ca. 395,000EUR
Område
Madrid Retiro, Madrid
Type
Commercial property
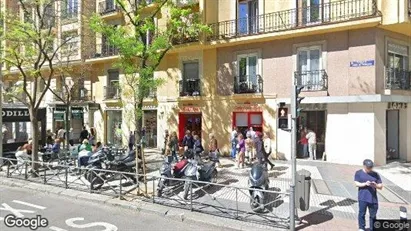
Commercial property in Madrid Salamanca, Madrid
 More info
Commercial property in Madrid Salamanca, Madrid
Commercial property En venta en Madrid Salamanca, Madrid
Areal
Ca. 90 m2
Pris
Ca. 630,000EUR
Område
Madrid Salamanca, Madrid
Type
Commercial property
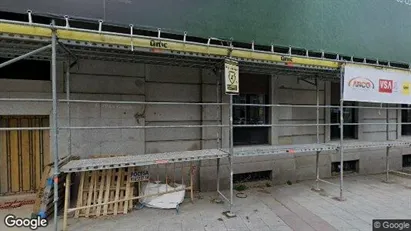
Commercial property in Madrid Arganzuela, Madrid
 More info
Commercial property in Madrid Arganzuela, Madrid
Commercial property En venta en Madrid Arganzuela, Madrid
Areal
Ca. 235 m2
Pris
Ca. 1,688,000EUR
Område
Madrid Arganzuela, Madrid
Type
Commercial property
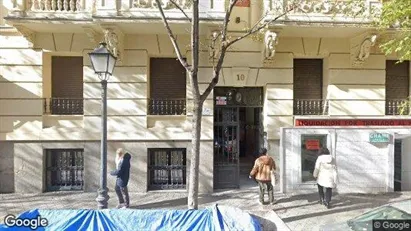
Commercial property in Madrid Chamberí, Madrid
 More info
Commercial property in Madrid Chamberí, Madrid
Commercial property En venta en Madrid Chamberí, Madrid
Areal
Ca. 110 m2
Pris
Ca. 960,000EUR
Område
Madrid Chamberí, Madrid
Type
Commercial property
Commercial property in Madrid Chamberí, Madrid
 More info
Commercial property in Madrid Chamberí, Madrid
Commercial property En venta en Madrid Chamberí, Madrid
Areal
Ca. 130 m2
Pris
Ca. 939,000EUR
Område
Madrid Chamberí, Madrid
Type
Commercial property
Commercial property in Madrid Retiro, Madrid
 More info
Commercial property in Madrid Retiro, Madrid
Commercial property En venta en Madrid Retiro, Madrid
Areal
Ca. 40 m2
Pris
Ca. 502,000EUR
Område
Madrid Retiro, Madrid
Type
Commercial property
Commercial property in Madrid Chamberí, Madrid
 More info
Commercial property in Madrid Chamberí, Madrid
Commercial property En venta en Madrid Chamberí, Madrid
Areal
Ca. 75 m2
Pris
Ca. 480,000EUR
Område
Madrid Chamberí, Madrid
Type
Commercial property
Commercial property in Madrid Centro, Madrid
 More info
Commercial property in Madrid Centro, Madrid
Commercial property En venta en Madrid Centro, Madrid
Areal
Ca. 85 m2
Pris
Ca. 1,320,000EUR
Område
Madrid Centro, Madrid
Type
Commercial property
Office space in Alcobendas, Comunidad de Madrid
 More info
Office space in Alcobendas, Comunidad de Madrid
Office space for rent in Alcobendas, Comunidad de Madrid
Areal
Ca. 5 m2
Pris pr. md.
Not stated
Område
Alcobendas, Comunidad de Madrid
Type
Office space
Commercial space in San Sebastián de los Reyes, Comunidad de Madrid
 More info
Commercial space in San Sebastián de los Reyes, Comunidad de Madrid
Commercial space for rent in San Sebastián de los Reyes, Comunidad de Madrid
Areal
Ca. 1,345 m2
Pris pr. md.
Ca. 10,100 EUR pr md
Område
San Sebastián de los Reyes, Comunidad de Madrid
Type
Commercial property
Commercial space in Madrid Tetuán, Madrid
 More info
Commercial space in Madrid Tetuán, Madrid
Commercial space for rent in Madrid Tetuán, Madrid
Areal
Ca. 105 m2
Pris pr. md.
Ca. 2,200 EUR pr md
Område
Madrid Tetuán, Madrid
Type
Commercial property
Office space in Tres Cantos, Comunidad de Madrid
 More info
Office space in Tres Cantos, Comunidad de Madrid
Office space for rent in Tres Cantos, Comunidad de Madrid
Areal
Ca. 920 m2
Pris pr. md.
Not stated
Område
Tres Cantos, Comunidad de Madrid
Type
Office space
Office space in Alcobendas, Comunidad de Madrid
 More info
Office space in Alcobendas, Comunidad de Madrid
Office space for rent in Alcobendas, Comunidad de Madrid
Areal
Ca. 345 m2
Pris pr. md.
Ca. 4,300 EUR pr md
Område
Alcobendas, Comunidad de Madrid
Type
Office space
Office space in Villaviciosa de Odón, Comunidad de Madrid
 More info
Office space in Villaviciosa de Odón, Comunidad de Madrid
Office space for rent in Villaviciosa de Odón, Comunidad de Madrid
Areal
-
Pris pr. md.
Ca. 3,000 EUR pr md
Område
Villaviciosa de Odón, Comunidad de Madrid
Type
Office space
Office space in Pozuelo de Alarcón, Comunidad de Madrid
 More info
Office space in Pozuelo de Alarcón, Comunidad de Madrid
Office space for rent in Pozuelo de Alarcón, Comunidad de Madrid
Areal
Ca. 495 m2
Pris pr. md.
Not stated
Område
Pozuelo de Alarcón, Comunidad de Madrid
Type
Office space
Industrial property in Villaviciosa de Odón, Comunidad de Madrid
 More info
Industrial property in Villaviciosa de Odón, Comunidad de Madrid
Industrial property for rent in Villaviciosa de Odón, Comunidad de Madrid
Areal
-
Pris pr. md.
Ca. 12,500 EUR pr md
Område
Villaviciosa de Odón, Comunidad de Madrid
Type
Industrial property
Commercial space in Madrid Ciudad Lineal, Madrid
 More info
Commercial space in Madrid Ciudad Lineal, Madrid
Commercial space for rent in Madrid Ciudad Lineal, Madrid
Areal
Ca. 5 m2
Pris pr. md.
Ca. 500 EUR pr md
Område
Madrid Ciudad Lineal, Madrid
Type
Commercial property
Commercial space in Madrid Tetuán, Madrid
 More info
Commercial space in Madrid Tetuán, Madrid
Commercial space for rent in Madrid Tetuán, Madrid
Areal
Ca. 25 m2
Pris pr. md.
Ca. 100 EUR pr md
Område
Madrid Tetuán, Madrid
Type
Commercial property
Selected customers
30,000 customers use Companyspace.com
30,000 customers
285,000 companies in our database
2,400 rentals annually
Companyspace.com is used by thousands of landlords, property companies, commercial real estate agents, investors and business centres seeking greater visibility, more enquiries and lower vacancy rates.


