


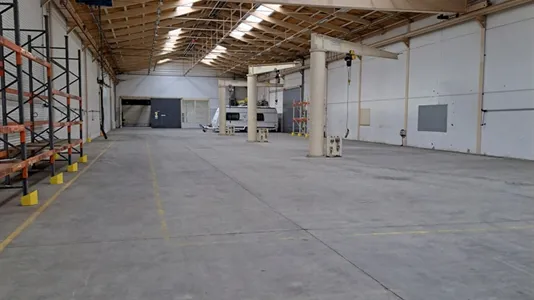
Industrial property for rent, Randers NV, Randers,
, 8920 Randers NV- Industrial property for rent
- 500 - 6,000 m2
- 175,000 DKK per month
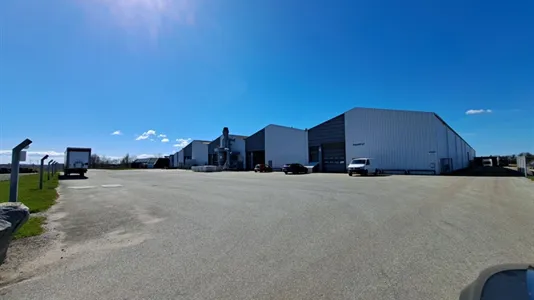
![Industrial property for rent, Randers NV, Randers, <span class="blurred street" onclick="ProcessAdRequest(2264341)"><span class="hint">See streetname</span>[xxxxxxxxxxxxx]</span>](https://cdkimages.rentbuyestate.com/photo/PreviewList/2421282.jpg?t=638631936335130000)
- Industrial property for rent
- 500 - 6,000 m2
- 175,000 DKK per month
Industrial property for rent, Randers NV, Randers,
29 kr pr kvm Lager, værkested og produktion lokaler.
Porte 3 stk 4 x 4,2 m
Der er svejse udsugningsudstyr med genveksanlæg
3 stk haller i sammenhængende fra 1350 kvm og op til 5000 kvm
Der er mulighed for kontor ved siden af i samme bygning lokaler fra 1 plads op til 50 pladser og kantine og baderum
Information and data
This industrial property for rent, is located in Randers NV. Randers NV is located in Randers. The company space is 6000 m2 in total. You can rent this industrial property for 2,100,000 DKK per year.
Similar search results
-
877 m2 warehouse for rent in Randers NV, Randers
- 29,000 DKK per month
- 396 DKK /m2/year
-
8990 m2 warehouse for rent in Randers NV, Randers
- 166,667 DKK per month
- 222 DKK /m2/year
-
235 m2 office space for rent in Randers NV, Randers
- 6,000 DKK per month
- 306 DKK /m2/year
-
10 m2 office space for rent in Randers NV, Randers
- 3,000 DKK per month
- 3,600 DKK /m2/year
-
877 m2 commercial space for rent in Randers NV, Randers
- 74,782 DKK per month
- 1,023 DKK /m2/year


Frequently asked questions
Statistics on the development of available industrial properties for rent in Randers NV over the past month
Below you can see the development of available industrial properties for rent in Randers NV over the past month. In the first column you see the date. In the second column you see the total amount of industrial properties for rent in Randers NV on the date. In the third column you see the amount of new industrial properties in Randers NV that was available for rent on the date. In the fourth column you see the amount of industrial properties in Randers NV that was rented on the date. Also see aggregate statistics on all available industrial properties in Randers NV over time, aggregate statistics on new industrial properties in Randers NV over time, aggregate statistics on rented industrial properties in Randers NV over time
| Date | All industrial properties for rent | New industrial properties for rent | Rented out industrial properties |
|---|---|---|---|
| 21. October 2025 | 6 | 2 | 0 |
| 20. October 2025 | 4 | 0 | 0 |
| 19. October 2025 | 4 | 0 | 0 |
| 18. October 2025 | 4 | 0 | 0 |
| 17. October 2025 | 4 | 0 | 0 |
| 16. October 2025 | 4 | 0 | 0 |
| 15. October 2025 | 4 | 0 | 0 |
| 14. October 2025 | 4 | 0 | 0 |
| 13. October 2025 | 4 | 0 | 0 |
| 12. October 2025 | 4 | 0 | 0 |
| 11. October 2025 | 4 | 0 | 0 |
| 10. October 2025 | 4 | 0 | 0 |
| 9. October 2025 | 4 | 0 | 0 |
| 8. October 2025 | 4 | 0 | 0 |
| 7. October 2025 | 4 | 0 | 0 |
| 6. October 2025 | 4 | 0 | 0 |
| 5. October 2025 | 4 | 0 | 0 |
| 4. October 2025 | 4 | 0 | 0 |
| 3. October 2025 | 4 | 0 | 0 |
| 2. October 2025 | 4 | 0 | 0 |
| 1. October 2025 | 4 | 0 | 0 |
| 30. September 2025 | 4 | 0 | 0 |
| 29. September 2025 | 4 | 0 | 0 |
| 28. September 2025 | 4 | 0 | 0 |
| 27. September 2025 | 4 | 0 | 0 |
| 26. September 2025 | 4 | 0 | 0 |
| 25. September 2025 | 4 | 0 | 0 |
| 24. September 2025 | 4 | 0 | 0 |
| 23. September 2025 | 4 | 0 | 0 |
| 22. September 2025 | 4 | 0 | 0 |
| 21. September 2025 | 4 | 0 | 0 |
Statistics on currently available industrial properties for rent in Randers NV
In the table below, you see a series of data about available industrial properties to rent in Randers NV.Also see gathered statistics of all available industrial properties in Randers NV over time, the gathered statistics of new industrial properties in Randers NV over time, the gathered statistics of rented industrial properties in Randers NV over time
| Industrial properties | |
|---|---|
| Available premises | 6 |
| New premises since yesterday | 2 |
| Rented out premises since yesterday | 0 |
| Total available m2 | 35,867 |
| Average price per m2 per year without expenses | 45 |
| Highest price per m2 per year | 53 |
| Lowest price per m2 per year | 30 |