


Commercial premises for rentin Utrecht
There are 1,082 available commercial properties in Utrecht right now. Companyspace.com collects commercial properties from many different parts of the market, so that you as a company can more easily get an overview of available commercial properties in Utrecht.
Companyspace.com today:
New today 613
Updated 24h 635
Notifications about new companyspaces2,198
Copenhagen +3
Stockholm +4
Amsterdam +12
Berlin +1
Zürich +2
Vienna +15
Paris +5
Madrid +1
Dublin (county) +48
Warsaw +12
Greater London +6
Latest update 55 min ago
Active ads 369,552
1,082 company spaces found
Office space in Utrecht Leidsche Rijn, Utrecht
 More info
Office space in Utrecht Leidsche Rijn, Utrecht
Office space for rent in Utrecht Leidsche Rijn, Utrecht
Areal
Ca. 30 m2
Pris pr. md.
Ca. 950 EUR pr md
Område
Utrecht Leidsche Rijn, Utrecht
Type
Office space
Office space in Utrecht Leidsche Rijn, Utrecht
 More info
Office space in Utrecht Leidsche Rijn, Utrecht
Office space for rent in Utrecht Leidsche Rijn, Utrecht
Areal
Ca. 240 m2
Pris pr. md.
Ca. 9,350 EUR pr md
Område
Utrecht Leidsche Rijn, Utrecht
Type
Office space
Office space in Utrecht Leidsche Rijn, Utrecht
 More info
Office space in Utrecht Leidsche Rijn, Utrecht
Office space for rent in Utrecht Leidsche Rijn, Utrecht
Areal
Ca. 45 m2
Pris pr. md.
Ca. 1,850 EUR pr md
Område
Utrecht Leidsche Rijn, Utrecht
Type
Office space
Office space in Utrecht Leidsche Rijn, Utrecht
 More info
Office space in Utrecht Leidsche Rijn, Utrecht
Office space for rent in Utrecht Leidsche Rijn, Utrecht
Areal
Ca. 70 m2
Pris pr. md.
Ca. 2,750 EUR pr md
Område
Utrecht Leidsche Rijn, Utrecht
Type
Office space
Office space in Utrecht Leidsche Rijn, Utrecht
 More info
Office space in Utrecht Leidsche Rijn, Utrecht
Office space for rent in Utrecht Leidsche Rijn, Utrecht
Areal
Ca. 15 m2
Pris pr. md.
Ca. 250 EUR pr md
Område
Utrecht Leidsche Rijn, Utrecht
Type
Office space
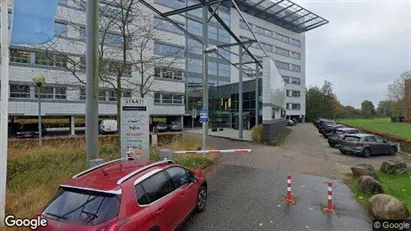
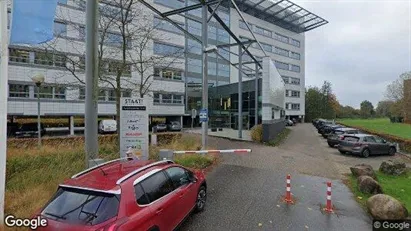
Office space in Utrecht West, Utrecht
 More info
Office space in Utrecht West, Utrecht
Te huur: representatieve kantoorruimte 237 m² + 4 parkeerplaatsen, Utrecht (Savannahweg 71)
Per direct beschikbaar | Optionele overname inventaris en meub...
Areal
Ca. 235 m2
Pris pr. md.
Ca. 8,350 EUR pr md
Område
Utrecht West, Utrecht
Type
Office space
Office space in Utrecht Leidsche Rijn, Utrecht
 More info
Office space in Utrecht Leidsche Rijn, Utrecht
Office space for rent in Utrecht Leidsche Rijn, Utrecht
Areal
Ca. 120 m2
Pris pr. md.
Ca. 6,100 EUR pr md
Område
Utrecht Leidsche Rijn, Utrecht
Type
Office space
Office space in Utrecht Leidsche Rijn, Utrecht
 More info
Office space in Utrecht Leidsche Rijn, Utrecht
Office space for rent in Utrecht Leidsche Rijn, Utrecht
Areal
Ca. 30 m2
Pris pr. md.
Ca. 1,450 EUR pr md
Område
Utrecht Leidsche Rijn, Utrecht
Type
Office space
Office space in Utrecht Leidsche Rijn, Utrecht
 More info
Office space in Utrecht Leidsche Rijn, Utrecht
Office space for rent in Utrecht Leidsche Rijn, Utrecht
Areal
Ca. 70 m2
Pris pr. md.
Ca. 3,250 EUR pr md
Område
Utrecht Leidsche Rijn, Utrecht
Type
Office space
Office space in Utrecht Leidsche Rijn, Utrecht
 More info
Office space in Utrecht Leidsche Rijn, Utrecht
Office space for rent in Utrecht Leidsche Rijn, Utrecht
Areal
Ca. 15 m2
Pris pr. md.
Ca. 600 EUR pr md
Område
Utrecht Leidsche Rijn, Utrecht
Type
Office space
Office space in Utrecht Zuid-West, Utrecht
 More info
Office space in Utrecht Zuid-West, Utrecht
Office space for rent in Utrecht Zuid-West, Utrecht
Areal
Ca. 15 m2
Pris pr. md.
Ca. 1,000 EUR pr md
Område
Utrecht Zuid-West, Utrecht
Type
Office space
Office space in Utrecht Leidsche Rijn, Utrecht
 More info
Office space in Utrecht Leidsche Rijn, Utrecht
Office space for rent in Utrecht Leidsche Rijn, Utrecht
Areal
Ca. 240 m2
Pris pr. md.
Ca. 9,250 EUR pr md
Område
Utrecht Leidsche Rijn, Utrecht
Type
Office space
Commercial space in Utrecht West, Utrecht
 More info
Commercial space in Utrecht West, Utrecht
Commercial space for rent in Utrecht West, Utrecht
Areal
Ca. 130 m2
Pris pr. md.
Ca. 1,700 EUR pr md
Område
Utrecht West, Utrecht
Type
Commercial property
Office space in Utrecht Zuid-West, Utrecht
 More info
Office space in Utrecht Zuid-West, Utrecht
Office space for rent in Utrecht Zuid-West, Utrecht
Areal
Ca. 30 m2
Pris pr. md.
Ca. 2,000 EUR pr md
Område
Utrecht Zuid-West, Utrecht
Type
Office space
Office space in Utrecht Leidsche Rijn, Utrecht
 More info
Office space in Utrecht Leidsche Rijn, Utrecht
Office space for rent in Utrecht Leidsche Rijn, Utrecht
Areal
Ca. 45 m2
Pris pr. md.
Ca. 2,100 EUR pr md
Område
Utrecht Leidsche Rijn, Utrecht
Type
Office space
Commercial space in Utrecht West, Utrecht
 More info
Commercial space in Utrecht West, Utrecht
Commercial space for rent in Utrecht West, Utrecht
Areal
Ca. 65 m2
Pris pr. md.
Ca. 1,700 EUR pr md
Område
Utrecht West, Utrecht
Type
Commercial property
Office space in Utrecht Leidsche Rijn, Utrecht
 More info
Office space in Utrecht Leidsche Rijn, Utrecht
Office space for rent in Utrecht Leidsche Rijn, Utrecht
Areal
Ca. 10 m2
Pris pr. md.
Ca. 50 EUR pr md
Område
Utrecht Leidsche Rijn, Utrecht
Type
Office space
Office space in Utrecht Zuid-West, Utrecht
 More info
Office space in Utrecht Zuid-West, Utrecht
Office space for rent in Utrecht Zuid-West, Utrecht
Areal
Ca. 10 m2
Pris pr. md.
Ca. 50 EUR pr md
Område
Utrecht Zuid-West, Utrecht
Type
Office space
Selected customers
30,000 customers use Companyspace.com
30,000 customers
285,000 companies in our database
2,400 rentals annually
Companyspace.com is used by thousands of landlords, property companies, commercial real estate agents, investors and business centres seeking greater visibility, more enquiries and lower vacancy rates.


