


Commercial premises for rentin Utrecht
There are 1,100 available commercial properties in Utrecht right now. Companyspace.com collects commercial properties from many different parts of the market, so that you as a company can more easily get an overview of available commercial properties in Utrecht.
Companyspace.com today:
New today 494
Updated 24h 500
Notifications about new companyspaces1,621
Copenhagen +3
Stockholm +2
Brussels +5
Latest update 19 min ago
Active ads 312,394
1,100 company spaces found
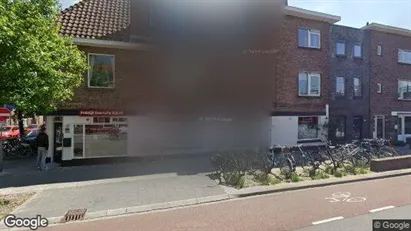
Clinic in Utrecht Oost, Utrecht
 More info
Clinic in Utrecht Oost, Utrecht
Praktijkruimte te huur in onze gezondheid en welzijnspraktijk VaartscheRijn. De ruimtes bevinden zich op de begane grond en zijn rolstoel toegankelijk. De pr...
Areal
Ca. 120 m2
Pris pr. md.
Not stated
Område
Utrecht Oost, Utrecht
Type
Clinic
Clinic in Utrecht Vleuten-De Meern, Utrecht
More info
We monitor the market!
Clinic in Utrecht Vleuten-De Meern, Utrecht
Modern, goed toegankelijk , airco, wachtkamer, keuken, advertentieruimte
Areal
Ca. 50 m2
Pris pr. md.
Not stated
Område
Utrecht Vleuten-De Meern, Utrecht
Type
Clinic
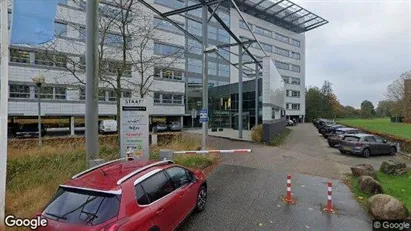
Office space in Utrecht Leidsche Rijn, Utrecht
 More info
Office space in Utrecht Leidsche Rijn, Utrecht
Office space for rent in Utrecht Leidsche Rijn, Utrecht
Areal
Ca. 30 m2
Pris pr. md.
Ca. 450 EUR pr md
Område
Utrecht Leidsche Rijn, Utrecht
Type
Office space
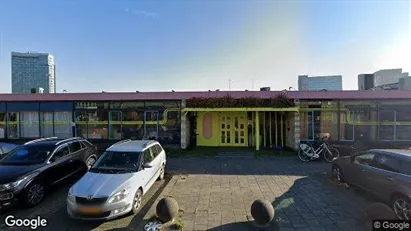
Office space in Utrecht Zuid-West, Utrecht
 More info
Office space in Utrecht Zuid-West, Utrecht
Office space for rent in Utrecht Zuid-West, Utrecht
Areal
Ca. 30 m2
Pris pr. md.
Ca. 400 EUR pr md
Område
Utrecht Zuid-West, Utrecht
Type
Office space
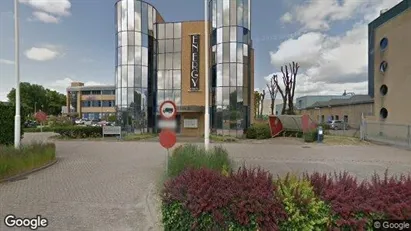
Office space in Utrecht West, Utrecht
 More info
Office space in Utrecht West, Utrecht
Office space for rent in Utrecht West, Utrecht
Areal
Ca. 60 m2
Pris pr. md.
Ca. 350 EUR pr md
Område
Utrecht West, Utrecht
Type
Office space
Office space in Utrecht Oost, Utrecht
 More info
Office space in Utrecht Oost, Utrecht
Office space for rent in Utrecht Oost, Utrecht
Areal
Ca. 925 m2
Pris pr. md.
Not stated
Område
Utrecht Oost, Utrecht
Type
Office space
Office space in Utrecht Oost, Utrecht
 More info
Office space in Utrecht Oost, Utrecht
Office space for rent in Utrecht Oost, Utrecht
Areal
Ca. 760 m2
Pris pr. md.
Not stated
Område
Utrecht Oost, Utrecht
Type
Office space
Commercial space in Utrecht Overvecht, Utrecht
 More info
Commercial space in Utrecht Overvecht, Utrecht
Commercial space for rent in Utrecht Overvecht, Utrecht
Areal
Ca. 135 m2
Pris pr. md.
Ca. 1,400 EUR pr md
Område
Utrecht Overvecht, Utrecht
Type
Commercial property
Office space in Utrecht Binnenstad, Utrecht
 More info
Office space in Utrecht Binnenstad, Utrecht
Office space for rent in Utrecht Binnenstad, Utrecht
Areal
Ca. 70 m2
Pris pr. md.
Ca. 3,200 EUR pr md
Område
Utrecht Binnenstad, Utrecht
Type
Office space
Commercial space in Utrecht Binnenstad, Utrecht
 More info
Commercial space in Utrecht Binnenstad, Utrecht
Commercial space for rent in Utrecht Binnenstad, Utrecht
Areal
Ca. 240 m2
Pris pr. md.
Ca. 9,800 EUR pr md
Område
Utrecht Binnenstad, Utrecht
Type
Commercial property
Office space in Utrecht Zuid-West, Utrecht
 More info
Office space in Utrecht Zuid-West, Utrecht
Office space for rent in Utrecht Zuid-West, Utrecht
Areal
Ca. 45 m2
Pris pr. md.
Ca. 3,150 EUR pr md
Område
Utrecht Zuid-West, Utrecht
Type
Office space
Office space in Utrecht Binnenstad, Utrecht
 More info
Office space in Utrecht Binnenstad, Utrecht
Office space for rent in Utrecht Binnenstad, Utrecht
Areal
Ca. 45 m2
Pris pr. md.
Ca. 2,300 EUR pr md
Område
Utrecht Binnenstad, Utrecht
Type
Office space
Office space in Utrecht Binnenstad, Utrecht
 More info
Office space in Utrecht Binnenstad, Utrecht
Office space for rent in Utrecht Binnenstad, Utrecht
Areal
Ca. 10 m2
Pris pr. md.
Ca. 150 EUR pr md
Område
Utrecht Binnenstad, Utrecht
Type
Office space
Commercial space in Utrecht Leidsche Rijn, Utrecht
 More info
Commercial space in Utrecht Leidsche Rijn, Utrecht
Commercial space for rent in Utrecht Leidsche Rijn, Utrecht
Areal
Ca. 210 m2
Pris pr. md.
Ca. 2,100 EUR pr md
Område
Utrecht Leidsche Rijn, Utrecht
Type
Commercial property
Office space in Utrecht Zuid-West, Utrecht
 More info
Office space in Utrecht Zuid-West, Utrecht
Office space for rent in Utrecht Zuid-West, Utrecht
Areal
Ca. 30 m2
Pris pr. md.
Ca. 1,750 EUR pr md
Område
Utrecht Zuid-West, Utrecht
Type
Office space
Office space in Utrecht Zuid-West, Utrecht
 More info
Office space in Utrecht Zuid-West, Utrecht
Office space for rent in Utrecht Zuid-West, Utrecht
Areal
Ca. 240 m2
Pris pr. md.
Ca. 15,050 EUR pr md
Område
Utrecht Zuid-West, Utrecht
Type
Office space
Commercial space in Utrecht West, Utrecht
 More info
Commercial space in Utrecht West, Utrecht
Commercial space for rent in Utrecht West, Utrecht
Areal
Ca. 100 m2
Pris pr. md.
Ca. 1,000 EUR pr md
Område
Utrecht West, Utrecht
Type
Commercial property
Office space in Utrecht Zuid-West, Utrecht
 More info
Office space in Utrecht Zuid-West, Utrecht
Office space for rent in Utrecht Zuid-West, Utrecht
Areal
Ca. 10 m2
Pris pr. md.
Ca. 150 EUR pr md
Område
Utrecht Zuid-West, Utrecht
Type
Office space
Selected customers
30,000 customers use Companyspace.com
30,000 customers
285,000 companies in our database
2,400 rentals annually
Companyspace.com is used by thousands of landlords, property companies, commercial real estate agents, investors and business centres seeking greater visibility, more enquiries and lower vacancy rates.


