


Commercial property for rentin Utrecht
There are 235 available commercial propertiesin Utrecht right now. Companyspace.com collects commercial properties from many different parts of the market, so that you as a company can more easily get an overview of available commercial propertiesin Utrecht.
Companyspace.com today:
New today 494
Updated 24h 500
Notifications about new companyspaces1,624
Copenhagen +3
Stockholm +2
Brussels +5
Latest update 6 min ago
Active ads 307,189
235 commercial properties found
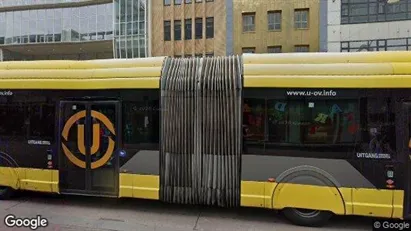
Commercial space in Utrecht Overvecht, Utrecht
 More info
Commercial space in Utrecht Overvecht, Utrecht
Commercial space for rent in Utrecht Overvecht, Utrecht
Areal
Ca. 135 m2
Pris pr. md.
Ca. 1,400 EUR pr md
Område
Utrecht Overvecht, Utrecht
Type
Commercial property
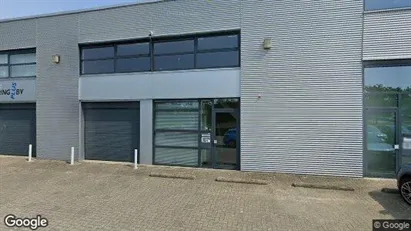
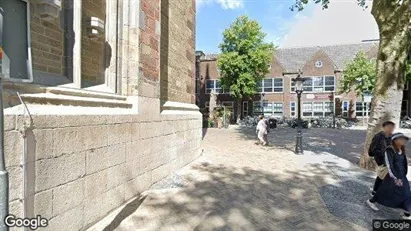
Commercial space in Utrecht Binnenstad, Utrecht
 More info
Commercial space in Utrecht Binnenstad, Utrecht
Commercial space for rent in Utrecht Binnenstad, Utrecht
Areal
Ca. 240 m2
Pris pr. md.
Ca. 9,800 EUR pr md
Område
Utrecht Binnenstad, Utrecht
Type
Commercial property
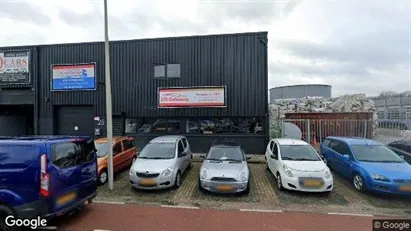
Commercial space in Utrecht Leidsche Rijn, Utrecht
 More info
Commercial space in Utrecht Leidsche Rijn, Utrecht
Commercial space for rent in Utrecht Leidsche Rijn, Utrecht
Areal
Ca. 210 m2
Pris pr. md.
Ca. 2,100 EUR pr md
Område
Utrecht Leidsche Rijn, Utrecht
Type
Commercial property
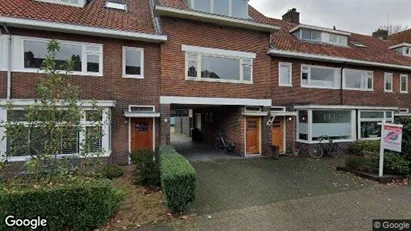
Commercial space in Utrecht West, Utrecht
 More info
Commercial space in Utrecht West, Utrecht
Commercial space for rent in Utrecht West, Utrecht
Areal
Ca. 100 m2
Pris pr. md.
Ca. 1,000 EUR pr md
Område
Utrecht West, Utrecht
Type
Commercial property
Commercial space in Utrecht Overvecht, Utrecht
 More info
Commercial space in Utrecht Overvecht, Utrecht
Commercial space for rent in Utrecht Overvecht, Utrecht
Areal
Ca. 385 m2
Pris pr. md.
Ca. 4,050 EUR pr md
Område
Utrecht Overvecht, Utrecht
Type
Commercial property
Commercial space in Utrecht Overvecht, Utrecht
 More info
Commercial space in Utrecht Overvecht, Utrecht
Commercial space for rent in Utrecht Overvecht, Utrecht
Areal
Ca. 1,250 m2
Pris pr. md.
Ca. 13,750 EUR pr md
Område
Utrecht Overvecht, Utrecht
Type
Commercial property
Commercial space in Utrecht Overvecht, Utrecht
 More info
Commercial space in Utrecht Overvecht, Utrecht
Commercial space for rent in Utrecht Overvecht, Utrecht
Areal
Ca. 210 m2
Pris pr. md.
Ca. 2,700 EUR pr md
Område
Utrecht Overvecht, Utrecht
Type
Commercial property
Commercial space in Utrecht Noord-Oost, Utrecht
 More info
Commercial space in Utrecht Noord-Oost, Utrecht
Commercial space for rent in Utrecht Noord-Oost, Utrecht
Areal
Ca. 135 m2
Pris pr. md.
Ca. 1,500 EUR pr md
Område
Utrecht Noord-Oost, Utrecht
Type
Commercial property
Commercial space in Utrecht Binnenstad, Utrecht
 More info
Commercial space in Utrecht Binnenstad, Utrecht
Commercial space for rent in Utrecht Binnenstad, Utrecht
Areal
Ca. 25 m2
Pris pr. md.
Ca. 300 EUR pr md
Område
Utrecht Binnenstad, Utrecht
Type
Commercial property
Commercial space in Utrecht West, Utrecht
 More info
Commercial space in Utrecht West, Utrecht
Commercial space for rent in Utrecht West, Utrecht
Areal
Ca. 130 m2
Pris pr. md.
Ca. 1,700 EUR pr md
Område
Utrecht West, Utrecht
Type
Commercial property
Commercial space in Utrecht West, Utrecht
 More info
Commercial space in Utrecht West, Utrecht
Commercial space for rent in Utrecht West, Utrecht
Areal
-
Pris pr. md.
Ca. 1,700 EUR pr md
Område
Utrecht West, Utrecht
Type
Commercial property
Commercial space in Utrecht West, Utrecht
 More info
Commercial space in Utrecht West, Utrecht
Commercial space for rent in Utrecht West, Utrecht
Areal
Ca. 65 m2
Pris pr. md.
Ca. 1,700 EUR pr md
Område
Utrecht West, Utrecht
Type
Commercial property
Commercial space in Utrecht Overvecht, Utrecht
 More info
Commercial space in Utrecht Overvecht, Utrecht
Commercial space for rent in Utrecht Overvecht, Utrecht
Areal
Ca. 790 m2
Pris pr. md.
Ca. 6,000 EUR pr md
Område
Utrecht Overvecht, Utrecht
Type
Commercial property
Commercial space in Utrecht Overvecht, Utrecht
 More info
Commercial space in Utrecht Overvecht, Utrecht
Commercial space for rent in Utrecht Overvecht, Utrecht
Areal
Ca. 2,260 m2
Pris pr. md.
Ca. 16,500 EUR pr md
Område
Utrecht Overvecht, Utrecht
Type
Commercial property
Commercial space in Utrecht West, Utrecht
 More info
Commercial space in Utrecht West, Utrecht
Commercial space for rent in Utrecht West, Utrecht
Areal
Ca. 75 m2
Pris pr. md.
Ca. 550 EUR pr md
Område
Utrecht West, Utrecht
Type
Commercial property
Commercial space in Utrecht Zuid-West, Utrecht
 More info
Commercial space in Utrecht Zuid-West, Utrecht
Commercial space for rent in Utrecht Zuid-West, Utrecht
Areal
Ca. 5,210 m2
Pris pr. md.
Not stated
Område
Utrecht Zuid-West, Utrecht
Type
Commercial property
Commercial space in Utrecht Overvecht, Utrecht
 More info
Commercial space in Utrecht Overvecht, Utrecht
Commercial space for rent in Utrecht Overvecht, Utrecht
Areal
Ca. 325 m2
Pris pr. md.
Ca. 400 EUR pr md
Område
Utrecht Overvecht, Utrecht
Type
Commercial property
Commercial space in Utrecht Noord-West, Utrecht
 More info
Commercial space in Utrecht Noord-West, Utrecht
Commercial space for rent in Utrecht Noord-West, Utrecht
Areal
20 - 25 m2
Pris pr. md.
Ca. 1,000 EUR pr md
Område
Utrecht Noord-West, Utrecht
Type
Commercial property
Selected customers
30,000 customers use Companyspace.com
30,000 customers
285,000 companies in our database
2,400 rentals annually
Companyspace.com is used by thousands of landlords, property companies, commercial real estate agents, investors and business centres seeking greater visibility, more enquiries and lower vacancy rates.


