


Industrial properties in Tilburg
Companyspace.com today:
New today 795
Updated 24h 1,574
Notifications about new companyspaces1,533
Copenhagen +3
Stockholm +4
Amsterdam +2
Brussels +7
Vienna +21
Dublin (county) +19
Warsaw +8
Roma (region) +2
Lisbon +1
Latest update 5 min ago
Active ads 364,927
3 industrial properties found
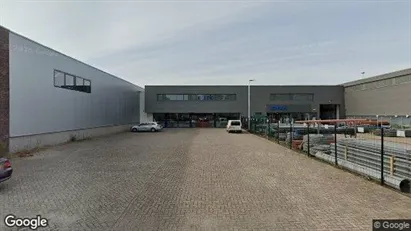
Industrial property in Tilburg, North Brabant
 More info
Industrial property in Tilburg, North Brabant
Industrial property for rent in Tilburg, North Brabant
Areal
Ca. 1,335 m2
Pris pr. md.
Ca. 8,750 EUR per month
Område
Tilburg, North Brabant
Type
Industrial property
Industrial property in Tilburg, North Brabant
 More info
Industrial property in Tilburg, North Brabant
Industrial property for rent in Tilburg, North Brabant
Areal
Ca. 2,050 m2
Pris pr. md.
Ca. 13,000 EUR per month
Område
Tilburg, North Brabant
Type
Industrial property
Industrial property in Tilburg, North Brabant
 More info
Industrial property in Tilburg, North Brabant
Productie te huur in Tilburg, Noord-Brabant
Areal
Ca. 90 m2
Pris pr. md.
Ca. 1,050 EUR per month
Område
Tilburg, North Brabant
Type
Industrial property
Selected customers


