


Industrial properties in Haaren
These commercial premises are closest to your search
We currently have no available commercial premises registered that match your search exactly. Therefore, we show below the commercial premises that best match your search based on the current market.
The shown listings may differ from your original search in terms of, for example, premises type, location, size or price, but they have been selected because they may be relevant alternatives for your business.
Take a look at the suggestions below – or start your search again here.
Companyspace.com today:
New today 710
Updated 24h 1,477
Notifications about new companyspaces103
Stockholm +1
Amsterdam +2
Berlin +3
Brussels +4
Vienna +21
Dublin (county) +19
Warsaw +6
Latest update 8 min ago
Active ads 365,460
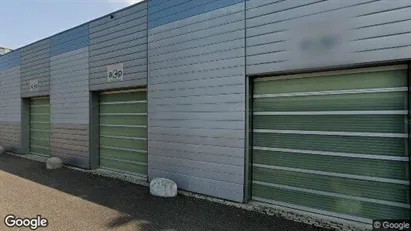
Shop in Deurne, North Brabant
 More info
Shop in Deurne, North Brabant
Winkelruimte te huur, ook geschikt als kantoorruimte of werkplaats, 200 M2, voldoende gratis parkeerplekken naast het pand, gelegenheid voor laden en lossen ...
Areal
Ca. 200 m2
Pris pr. md.
Not stated
Område
Deurne, North Brabant
Type
Shop
Clinic in Eindhoven, North Brabant
 More info
Clinic in Eindhoven, North Brabant
2 kamers met wachtkamer, wc en keuken
Areal
Ca. 100 m2
Pris pr. md.
Not stated
Område
Eindhoven, North Brabant
Type
Clinic
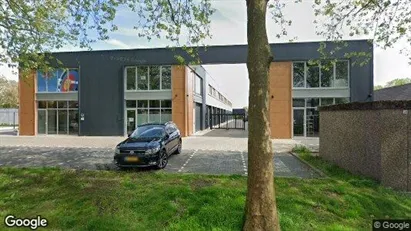
Commercial space in Oosterhout, North Brabant
 More info
Commercial space in Oosterhout, North Brabant
Commercial space for rent in Oosterhout, North Brabant
Areal
Ca. 1,060 m2
Pris pr. md.
Not stated
Område
Oosterhout, North Brabant
Type
Commercial property
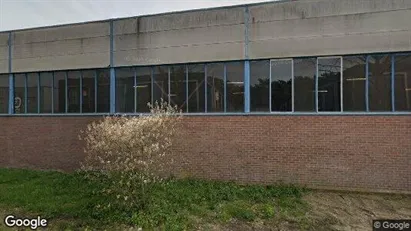
Office space in Eindhoven, North Brabant
 More info
Office space in Eindhoven, North Brabant
Office space for rent in Eindhoven, North Brabant
Areal
Ca. 70 m2
Pris pr. md.
Ca. 900 EUR per month
Område
Eindhoven, North Brabant
Type
Office space
Office space in Meierijstad, North Brabant
 More info
Office space in Meierijstad, North Brabant
Office space for rent in Meierijstad, North Brabant
Areal
Ca. 160 m2
Pris pr. md.
Ca. 1,200 EUR per month
Område
Meierijstad, North Brabant
Type
Office space
Office space in Eindhoven, North Brabant
 More info
Office space in Eindhoven, North Brabant
Office space for rent in Eindhoven, North Brabant
Areal
Ca. 30 m2
Pris pr. md.
Ca. 750 EUR per month
Område
Eindhoven, North Brabant
Type
Office space
Commercial space in Roosendaal, North Brabant
 More info
Commercial space in Roosendaal, North Brabant
Commercial space for rent in Roosendaal, North Brabant
Areal
Ca. 4,460 m2
Pris pr. md.
Not stated
Område
Roosendaal, North Brabant
Type
Commercial property
Office space in Eindhoven, North Brabant
 More info
Office space in Eindhoven, North Brabant
Office space for rent in Eindhoven, North Brabant
Areal
Ca. 70 m2
Pris pr. md.
Ca. 900 EUR per month
Område
Eindhoven, North Brabant
Type
Office space
Land in Valkenswaard, North Brabant
 More info
Land in Valkenswaard, North Brabant
Land for rent in Valkenswaard, North Brabant
Areal
-
Pris pr. md.
Ca. 5,450 EUR per month
Område
Valkenswaard, North Brabant
Type
Land
Office property in Roosendaal, North Brabant
 More info
Office property in Roosendaal, North Brabant
Office space for sale in Roosendaal, North Brabant
Areal
Ca. 120 m2
Pris
Ca. 225,000EUR
Område
Roosendaal, North Brabant
Type
Office space
Commercial space in Tilburg, North Brabant
 More info
Commercial space in Tilburg, North Brabant
Commercial space for rent in Tilburg, North Brabant
Areal
Ca. 130 m2
Pris pr. md.
Ca. 1,000 EUR per month
Område
Tilburg, North Brabant
Type
Commercial property
Commercial space in Etten-Leur, North Brabant
 More info
Commercial space in Etten-Leur, North Brabant
Commercial space for rent in Etten-Leur, North Brabant
Areal
Ca. 30 m2
Pris pr. md.
Ca. 25,000 EUR per month
Område
Etten-Leur, North Brabant
Type
Commercial property
Commercial space in Halderberge, North Brabant
 More info
Commercial space in Halderberge, North Brabant
Commercial space for rent in Halderberge, North Brabant
Areal
-
Pris pr. md.
Ca. 550 EUR per month
Område
Halderberge, North Brabant
Type
Commercial property
Commercial space in Eindhoven, North Brabant
 More info
Commercial space in Eindhoven, North Brabant
Commercial space for rent in Eindhoven, North Brabant
Areal
Ca. 320 m2
Pris pr. md.
Ca. 2,950 EUR per month
Område
Eindhoven, North Brabant
Type
Commercial property
Office space in Breda, North Brabant
 More info
Office space in Breda, North Brabant
Office space for rent in Breda, North Brabant
Areal
Ca. 110 m2
Pris pr. md.
Ca. 1,750 EUR per month
Område
Breda, North Brabant
Type
Office space
Office space in Breda, North Brabant
 More info
Office space in Breda, North Brabant
Office space for rent in Breda, North Brabant
Areal
Ca. 870 m2
Pris pr. md.
Not stated
Område
Breda, North Brabant
Type
Office space
Commercial space in Aalburg, North Brabant
 More info
Commercial space in Aalburg, North Brabant
Commercial space for rent in Aalburg, North Brabant
Areal
Ca. 155 m2
Pris pr. md.
Ca. 1,550 EUR per month
Område
Aalburg, North Brabant
Type
Commercial property
Office space in Eindhoven, North Brabant
 More info
Office space in Eindhoven, North Brabant
Office space for rent in Eindhoven, North Brabant
Areal
Ca. 150 m2
Pris pr. md.
Ca. 1,750 EUR per month
Område
Eindhoven, North Brabant
Type
Office space
Selected customers
Selected customers
30,000 customers use Companyspace.com
30,000 customers
285,000 companies in our database
2,400 rentals annually
Companyspace.com is used by thousands of landlords, property companies, commercial real estate agents, investors and business centres seeking greater visibility, more enquiries and lower vacancy rates.


