


Commercial property for renton Funen
There are 18 available commercial propertieson Funen right now. Companyspace.com collects commercial properties from many different parts of the market, so that you as a company can more easily get an overview of available commercial propertieson Funen.
Companyspace.com today:
New today 870
Updated 24h 3,311
Notifications about new companyspaces6,715
Copenhagen +1
Stockholm +1
Berlin +115
Vienna +12
Roma (region) +1
Greater London +1
Latest update 2 h ago
Active ads 365,805
18 commercial properties found
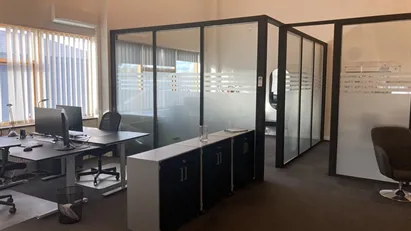
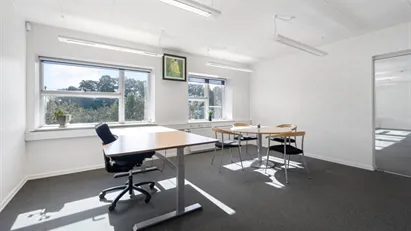
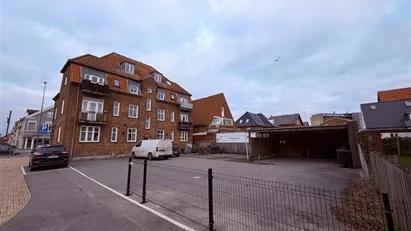
Office space in Nyborg, Funen
 More info
Office space in Nyborg, Funen
Office space for rent in Nyborg, Funen
Areal
Ca. 120 m2
Pris pr. md.
Ca. 8,500 DKK pr md
Område
Nyborg, Funen
Type
Office space
Office space in Odense SØ, Odense
 More info
Office space in Odense SØ, Odense
Office space for rent in Odense SØ, Odense
Areal
Ca. 15 m2
Pris pr. md.
Ca. 1,550 DKK pr md
Område
Odense SØ, Odense
Type
Office space
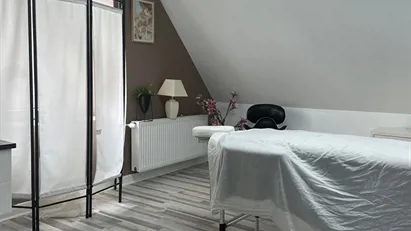
Clinic in Odense C, Odense
 More info
Clinic in Odense C, Odense
Clinic for rent in Odense C, Odense
Areal
Ca. 330 m2
Pris pr. md.
Ca. 27,000 DKK pr md
Område
Odense C, Odense
Type
Clinic
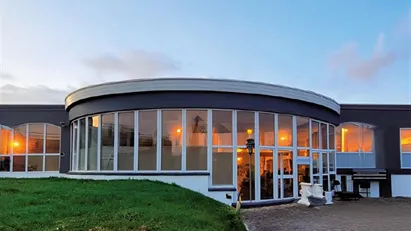
Office space in Årslev, Funen
 More info
Office space in Årslev, Funen
Office space for rent in Årslev, Funen
Areal
350 - 11,000 m2
Pris pr. md.
Ca. 183,350 DKK pr md
Område
Årslev, Funen
Type
Office space
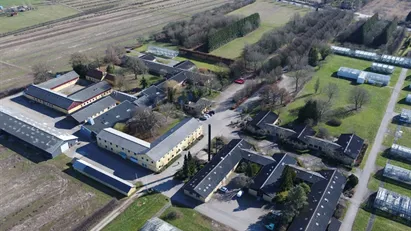
Office space in Svendborg, Funen
 More info
Office space in Svendborg, Funen
Office space for rent in Svendborg, Funen
Areal
Ca. 160 m2
Pris pr. md.
Ca. 4,500 DKK pr md
Område
Svendborg, Funen
Type
Office space
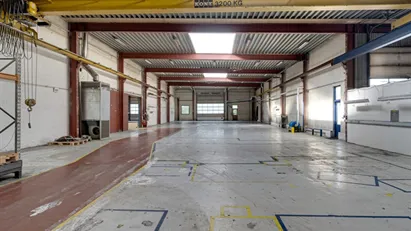
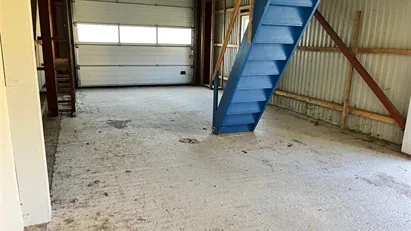
Warehouse in Ullerslev, Funen
 More info
Warehouse in Ullerslev, Funen
Warehouse for rent in Ullerslev, Funen
Areal
Ca. 2,000 m2
Pris pr. md.
Ca. 49,150 DKK pr md
Område
Ullerslev, Funen
Type
Warehouse
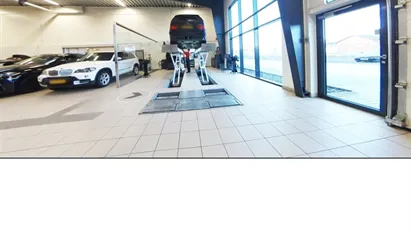
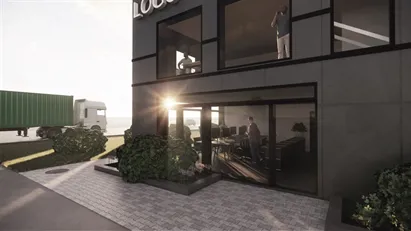
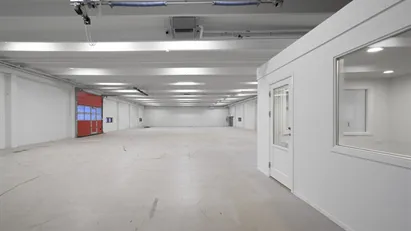
Industrial property in Odense SØ, Odense
 More info
Industrial property in Odense SØ, Odense
Industrial property for rent in Odense SØ, Odense
Areal
Ca. 275 m2
Pris pr. md.
Ca. 17,500 DKK pr md
Område
Odense SØ, Odense
Type
Industrial property
Office space in Ullerslev, Funen
 More info
Office space in Ullerslev, Funen
Office space for rent in Ullerslev, Funen
Areal
Ca. 15 m2
Pris pr. md.
Ca. 400 DKK pr md
Område
Ullerslev, Funen
Type
Office space
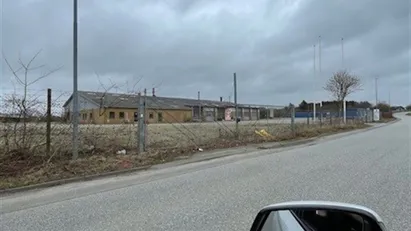
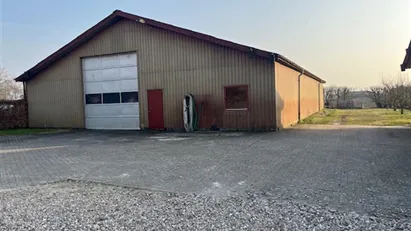
Warehouse in Aarup, Funen
 More info
Warehouse in Aarup, Funen
Warehouse for rent in Aarup, Funen
Areal
50 - 700 m2
Pris pr. md.
Ca. 20,000 DKK pr md
Område
Aarup, Funen
Type
Warehouse
Clinic in Odense SØ, Odense
 More info
Clinic in Odense SØ, Odense
Clinic for rent in Odense SØ, Odense
Areal
Ca. 45 m2
Pris pr. md.
Ca. 6,000 DKK pr md
Område
Odense SØ, Odense
Type
Clinic
Warehouse in Odense C, Odense
 More info
Warehouse in Odense C, Odense
Warehouse for rent in Odense C, Odense
Areal
Ca. 25 m2
Pris pr. md.
Ca. 1,500 DKK pr md
Område
Odense C, Odense
Type
Warehouse
Warehouse in Middelfart, Funen
 More info
Warehouse in Middelfart, Funen
Warehouse for rent in Middelfart, Funen
Areal
550 - 2,500 m2
Pris pr. md.
Ca. 119,800 DKK pr md
Område
Middelfart, Funen
Type
Warehouse
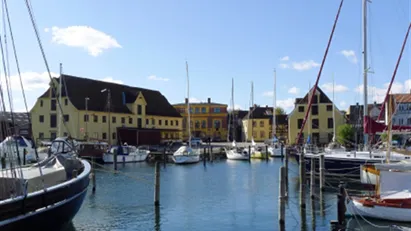
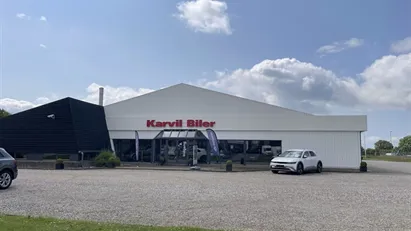
Shop in Svendborg, Funen
 More info
Shop in Svendborg, Funen
Shop for rent in Svendborg, Funen
Areal
Ca. 2,005 m2
Pris pr. md.
Ca. 83,600 DKK pr md
Område
Svendborg, Funen
Type
Shop
Warehouse in Middelfart, Funen
 More info
Warehouse in Middelfart, Funen
Warehouse for rent in Middelfart, Funen
Areal
Ca. 60 m2
Pris pr. md.
Ca. 2,000 DKK pr md
Område
Middelfart, Funen
Type
Warehouse
Warehouse in Odense SØ, Odense
 More info
Warehouse in Odense SØ, Odense
Warehouse for rent in Odense SØ, Odense
Areal
506 - 676 m2
Pris pr. md.
Ca. 19,700 DKK pr md
Område
Odense SØ, Odense
Type
Warehouse
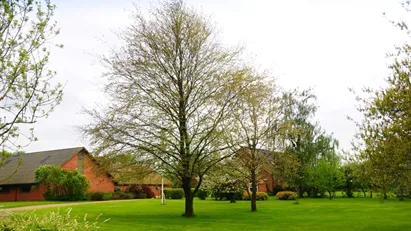
Warehouse in Oure, Funen
 More info
Warehouse in Oure, Funen
Warehouse for rent in Oure, Funen
Areal
Ca. 400 m2
Pris pr. md.
Ca. 6,650 DKK pr md
Område
Oure, Funen
Type
Warehouse
Warehouse in Ullerslev, Funen
 More info
Warehouse in Ullerslev, Funen
Warehouse for rent in Ullerslev, Funen
Areal
Ca. 20 m2
Pris pr. md.
Not stated
Område
Ullerslev, Funen
Type
Warehouse
Office space in Odense SØ, Odense
 More info
Office space in Odense SØ, Odense
Office space for rent in Odense SØ, Odense
Areal
10 - 12 m2
Pris pr. md.
Ca. 300 DKK pr md
Område
Odense SØ, Odense
Type
Office space
Selected customers
30,000 customers use Companyspace.com
30,000 customers
285,000 companies in our database
2,400 rentals annually
Companyspace.com is used by thousands of landlords, property companies, commercial real estate agents, investors and business centres seeking greater visibility, more enquiries and lower vacancy rates.


