


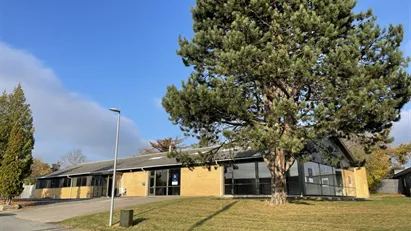
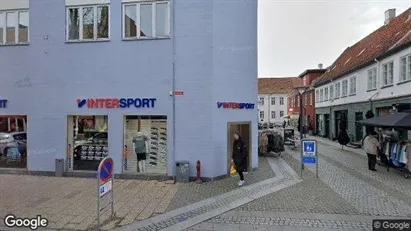
Photo provided by Google Street View and may be inaccurate:


Office space for rent, Nyborg, Funen, Dronningensvej 22A
- Ca. 120 m2
- Ca. 8,500 DKK per month

Office space for rent, Nyborg, Funen, Dronningensvej 22A

Ca. 120m2

Ca. 8,500 DKK

Office space

Nyborg, Funen
Facts
Report errors in data- 3646605
- Office space
- Ca. 120 m2
- Ca. 102,000 DKK
- Ca. 8,500 DKK
- Ca. 102,000 DKK
- Ca. 8,500 DKK
- Ca. 850 DKK
- Ca. 850 DKK
Similar search results
Shop in Nyborg, Funen
 More info
Shop in Nyborg, Funen
Shop for rent in Nyborg, Funen
Areal
Ca. 230 m2
Pris pr. md.
Ca. 13,650 DKK pr md
Område
Nyborg, Funen
Type
Shop
Office space in Nyborg, Funen
 More info
Office space in Nyborg, Funen
Office space for rent in Nyborg, Funen
Areal
Ca. 195 m2
Pris pr. md.
Ca. 11,450 DKK pr md
Område
Nyborg, Funen
Type
Office space
Commercial space in Nyborg, Funen
 More info
Commercial space in Nyborg, Funen
Commercial space for rent in Nyborg, Funen
Areal
Ca. 605 m2
Pris pr. md.
Ca. 32,950 DKK pr md
Område
Nyborg, Funen
Type
Commercial property
Shop in Nyborg, Funen
 More info
Shop in Nyborg, Funen
Shop for rent in Nyborg, Funen
Areal
Ca. 95 m2
Pris pr. md.
Ca. 9,550 DKK pr md
Område
Nyborg, Funen
Type
Shop
Shop in Nyborg, Funen
 More info
Shop in Nyborg, Funen
Shop for rent in Nyborg, Funen
Areal
Ca. 75 m2
Pris pr. md.
Ca. 10,550 DKK pr md
Område
Nyborg, Funen
Type
Shop
Office space in Nyborg, Funen
 More info
Office space in Nyborg, Funen
Office space for rent in Nyborg, Funen
Areal
Ca. 365 m2
Pris pr. md.
Ca. 12,350 DKK pr md
Område
Nyborg, Funen
Type
Office space
Office space in Nyborg, Funen
 More info
Office space in Nyborg, Funen
Office space for rent in Nyborg, Funen
Areal
Ca. 195 m2
Pris pr. md.
Ca. 11,450 DKK pr md
Område
Nyborg, Funen
Type
Office space
Office space in Nyborg, Funen
 More info
Office space in Nyborg, Funen
Office space for rent in Nyborg, Funen
Areal
Ca. 310 m2
Pris pr. md.
Ca. 16,800 DKK pr md
Område
Nyborg, Funen
Type
Office space
Warehouse in Nyborg, Funen
 More info
Warehouse in Nyborg, Funen
Warehouse for rent in Nyborg, Funen
Areal
Ca. 365 m2
Pris pr. md.
Ca. 12,350 DKK pr md
Område
Nyborg, Funen
Type
Warehouse
Selected customers
30,000 customers use Companyspace.com
30,000 customers
285,000 companies in our database
2,400 rentals annually
Companyspace.com is used by thousands of landlords, property companies, commercial real estate agents, investors and business centres seeking greater visibility, more enquiries and lower vacancy rates.


