


Commercial premises for rent in Europe
There are 281,960 available commercial properties in Europe right now. Companyspace.com collects commercial properties from many different parts of the market, so that you as a company can more easily get an overview of available commercial properties in Europe.
Companyspace.com today:
New today 515
Updated 24h 1,524
Notifications about new companyspaces1,781
Copenhagen +2
Amsterdam +12
Vienna +15
Paris +5
Dublin (county) +48
Warsaw +12
Greater London +6
Latest update 58 min ago
Active ads 369,103
281,960 company spaces found
Industrial property in Nykøbing Sjælland, Region Zealand
 More info
Industrial property in Nykøbing Sjælland, Region Zealand
Industrial property for rent in Nykøbing Sjælland, Region Zealand
Areal
Ca. 450 m2
Pris pr. md.
Ca. 9,300 DKK pr md
Område
Nykøbing Sjælland, Region Zealand
Type
Industrial property
Warehouse in Sorø, Region Zealand
 More info
Warehouse in Sorø, Region Zealand
Warehouse for rent in Sorø, Region Zealand
Areal
Ca. 1,345 m2
Pris pr. md.
Ca. 33,700 DKK pr md
Område
Sorø, Region Zealand
Type
Warehouse
Commercial space in Jyväskylä, Keski-Suomi
 More info
Commercial space in Jyväskylä, Keski-Suomi
Commercial space for rent in Jyväskylä, Keski-Suomi
Areal
Ca. 60 m2
Pris pr. md.
Not stated
Område
Jyväskylä, Keski-Suomi
Type
Commercial property
Office space in Hasselager, Aarhus
 More info
Office space in Hasselager, Aarhus
Office space for rent in Hasselager, Aarhus
Areal
Ca. 975 m2
Pris pr. md.
Ca. 85,100 DKK pr md
Område
Hasselager, Aarhus
Type
Office space
Office space in Kalundborg, Region Zealand
More info
Office space in Kalundborg, Region Zealand
Office space for rent in Kalundborg, Region Zealand
Areal
Ca. 680 m2
Pris pr. md.
Ca. 6,500 DKK pr md
Område
Kalundborg, Region Zealand
Type
Office space
Office space in Fredericia, Region of Southern Denmark
 More info
Office space in Fredericia, Region of Southern Denmark
Office space for rent in Fredericia, Region of Southern Denmark
Areal
Ca. 105 m2
Pris pr. md.
Ca. 5,800 DKK pr md
Område
Fredericia, Region of Southern Denmark
Type
Office space
Office space in Ieper, West-Vlaanderen
 More info
Office space in Ieper, West-Vlaanderen
Office space for rent in Ieper, West-Vlaanderen
Areal
Ca. 255 m2
Pris pr. md.
Ca. 1,300 EUR pr md
Område
Ieper, West-Vlaanderen
Type
Office space
Office space in Kalundborg, Region Zealand
More info
Office space in Kalundborg, Region Zealand
Office space for rent in Kalundborg, Region Zealand
Areal
Ca. 620 m2
Pris pr. md.
Ca. 5,200 DKK pr md
Område
Kalundborg, Region Zealand
Type
Office space
Commercial space in Oldebroek, Gelderland
 More info
Commercial space in Oldebroek, Gelderland
Commercial space for rent in Oldebroek, Gelderland
Areal
Ca. 145 m2
Pris pr. md.
Ca. 1,350 EUR pr md
Område
Oldebroek, Gelderland
Type
Commercial property
Office space in Copenhagen K, Copenhagen
More info
Office space in Copenhagen K, Copenhagen
Office space for rent in Copenhagen K, Copenhagen
Areal
Ca. 665 m2
Pris pr. md.
Ca. 116,550 DKK pr md
Område
Copenhagen K, Copenhagen
Type
Office space
Office space in Nea Smyrni, Attica
 More info
Office space in Nea Smyrni, Attica
Office space for rent in Nea Smyrni, Attica
Areal
Ca. 285 m2
Pris pr. md.
Ca. 4,500 EUR pr md
Område
Nea Smyrni, Attica
Type
Office space
Office space in Vantaa, Uusimaa
 More info
Office space in Vantaa, Uusimaa
Office space for rent in Vantaa, Uusimaa
Areal
Ca. 1,800 m2
Pris pr. md.
Not stated
Område
Vantaa, Uusimaa
Type
Office space
Office space in Aarhus N, Aarhus
More info
Office space in Aarhus N, Aarhus
Office space for rent in Aarhus N, Aarhus
Areal
Ca. 1,375 m2
Pris pr. md.
Ca. 127,350 DKK pr md
Område
Aarhus N, Aarhus
Type
Office space
Office space in Turku, Varsinais-Suomi
 More info
Office space in Turku, Varsinais-Suomi
Office space for rent in Turku, Varsinais-Suomi
Areal
-
Pris pr. md.
Not stated
Område
Turku, Varsinais-Suomi
Type
Office space
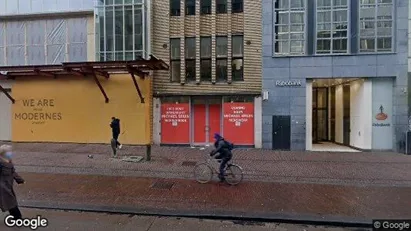
Office space in Rotterdam Centrum, Rotterdam
 More info
Office space in Rotterdam Centrum, Rotterdam
Kantoor te huur in Rotterdam Centrum, Rotterdam
Areal
13 - 471 m2
Pris pr. md.
Ca. 850 EUR pr md
Område
Rotterdam Centrum, Rotterdam
Type
Office space
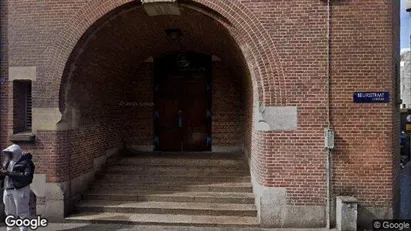
Office space in Amsterdam Centrum, Amsterdam
 More info
Office space in Amsterdam Centrum, Amsterdam
Office space for rent in Amsterdam Centrum, Amsterdam
Areal
Ca. 15 m2
Pris pr. md.
Ca. 850 EUR pr md
Område
Amsterdam Centrum, Amsterdam
Type
Office space
Office space in Utrecht Binnenstad, Utrecht
 More info
Office space in Utrecht Binnenstad, Utrecht
Kantoor te huur in Utrecht Binnenstad, Utrecht
Areal
21 - 100 m2
Pris pr. md.
Ca. 1,400 EUR pr md
Område
Utrecht Binnenstad, Utrecht
Type
Office space
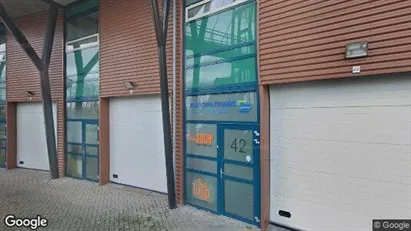
Commercial space in Amsterdam Oud-Zuid, Amsterdam
 More info
Commercial space in Amsterdam Oud-Zuid, Amsterdam
Pilotenstraat 42, 1059 CR Amsterdam
48,9 m² bedrijfsruimte op de eerste verdieping
Op een uitstekende locatie in Amsterdam bieden wij een nette en veel...
Areal
Ca. 50 m2
Pris pr. md.
Ca. 8,350 EUR pr md
Område
Amsterdam Oud-Zuid, Amsterdam
Type
Commercial property
Selected customers
30,000 customers use Companyspace.com
30,000 customers
285,000 companies in our database
2,400 rentals annually
Companyspace.com is used by thousands of landlords, property companies, commercial real estate agents, investors and business centres seeking greater visibility, more enquiries and lower vacancy rates.


