


Commercial premises for rent in Europe
There are 282,059 available commercial properties in Europe right now. Companyspace.com collects commercial properties from many different parts of the market, so that you as a company can more easily get an overview of available commercial properties in Europe.
Companyspace.com today:
New today 538
Updated 24h 1,527
Notifications about new companyspaces1,915
Copenhagen +2
Amsterdam +12
Berlin +1
Vienna +15
Paris +5
Dublin (county) +48
Warsaw +12
Greater London +6
Latest update 51 min ago
Active ads 369,192
282,059 company spaces found
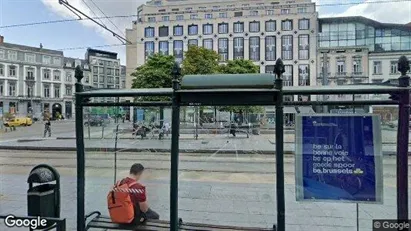
Office space in Brussels Elsene, Brussels
 More info
Office space in Brussels Elsene, Brussels
Office space for rent in Brussels Elsene, Brussels
Areal
Ca. 10 m2
Pris pr. md.
Ca. 150 EUR pr md
Område
Brussels Elsene, Brussels
Type
Office space
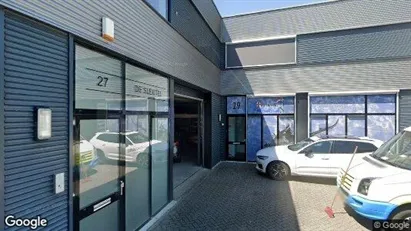
Office space in Westland, South Holland
 More info
Office space in Westland, South Holland
Office space for rent in Westland, South Holland
Areal
Ca. 145 m2
Pris pr. md.
Ca. 1,800 EUR pr md
Område
Westland, South Holland
Type
Office space
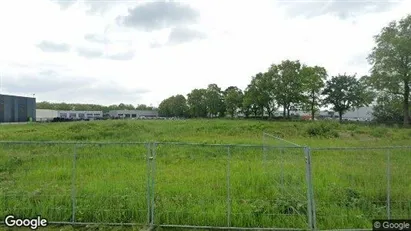
Industrial property in Hulst, Zeeland
 More info
Industrial property in Hulst, Zeeland
Industrial property for rent in Hulst, Zeeland
Areal
-
Pris pr. md.
Ca. 800 EUR pr md
Område
Hulst, Zeeland
Type
Industrial property
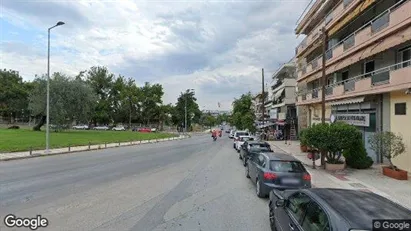
Commercial space in Roosendaal, North Brabant
 More info
Commercial space in Roosendaal, North Brabant
Commercial space for rent in Roosendaal, North Brabant
Areal
Ca. 180 m2
Pris pr. md.
Ca. 1,250 EUR pr md
Område
Roosendaal, North Brabant
Type
Commercial property
Office space in Thessaloniki, Central Macedonia
 More info
Office space in Thessaloniki, Central Macedonia
Office space for rent in Thessaloniki, Central Macedonia
Areal
Ca. 280 m2
Pris pr. md.
Ca. 2,500 EUR pr md
Område
Thessaloniki, Central Macedonia
Type
Office space
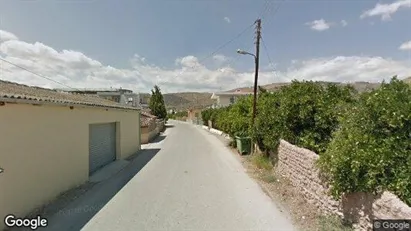
Warehouse in Argos-Mykines, Peloponnese
 More info
Warehouse in Argos-Mykines, Peloponnese
Warehouse for rent in Argos-Mykines, Peloponnese
Areal
Ca. 130 m2
Pris pr. md.
Ca. 450 EUR pr md
Område
Argos-Mykines, Peloponnese
Type
Warehouse
Office space in Kalundborg, Region Zealand
 More info
Office space in Kalundborg, Region Zealand
Office space for rent in Kalundborg, Region Zealand
Areal
Ca. 1,575 m2
Pris pr. md.
Ca. 39,350 DKK pr md
Område
Kalundborg, Region Zealand
Type
Office space
Warehouse in Kolding, Region of Southern Denmark
More info
Warehouse in Kolding, Region of Southern Denmark
Warehouse for rent in Kolding, Region of Southern Denmark
Areal
Ca. 270 m2
Pris pr. md.
Ca. 13,500 DKK pr md
Område
Kolding, Region of Southern Denmark
Type
Warehouse
Office space in Slagelse, Region Zealand
 More info
Office space in Slagelse, Region Zealand
Office space for rent in Slagelse, Region Zealand
Areal
Ca. 585 m2
Pris pr. md.
Ca. 44,050 DKK pr md
Område
Slagelse, Region Zealand
Type
Office space
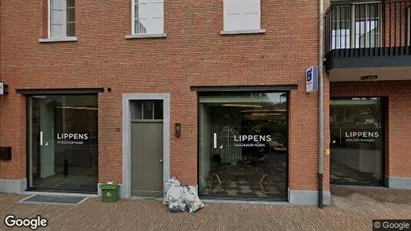
Commercial space in Brecht, Antwerp (Province)
 More info
Commercial space in Brecht, Antwerp (Province)
Commercial space for rent in Brecht, Antwerp (Province)
Areal
Ca. 80 m2
Pris pr. md.
Ca. 1,200 EUR pr md
Område
Brecht, Antwerp (Province)
Type
Commercial property
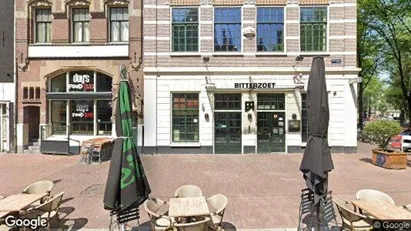
Office space in Amsterdam Centrum, Amsterdam
 More info
Office space in Amsterdam Centrum, Amsterdam
Office space for rent in Amsterdam Centrum, Amsterdam
Areal
Ca. 380 m2
Pris pr. md.
Ca. 6,450 EUR pr md
Område
Amsterdam Centrum, Amsterdam
Type
Office space
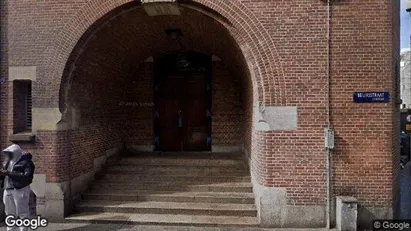
Office space in Amsterdam Centrum, Amsterdam
 More info
Office space in Amsterdam Centrum, Amsterdam
Office space for rent in Amsterdam Centrum, Amsterdam
Areal
Ca. 10 m2
Pris pr. md.
Ca. 300 EUR pr md
Område
Amsterdam Centrum, Amsterdam
Type
Office space
Office space in Kalundborg, Region Zealand
More info
Office space in Kalundborg, Region Zealand
Office space for rent in Kalundborg, Region Zealand
Areal
Ca. 1,395 m2
Pris pr. md.
Ca. 11,650 DKK pr md
Område
Kalundborg, Region Zealand
Type
Office space
Office space in Amsterdam Centrum, Amsterdam
 More info
Office space in Amsterdam Centrum, Amsterdam
Office space for rent in Amsterdam Centrum, Amsterdam
Areal
Ca. 30 m2
Pris pr. md.
Ca. 950 EUR pr md
Område
Amsterdam Centrum, Amsterdam
Type
Office space
Office space in Aarhus C, Aarhus
More info
Office space in Aarhus C, Aarhus
Office space for rent in Aarhus C, Aarhus
Areal
Ca. 145 m2
Pris pr. md.
Ca. 11,800 DKK pr md
Område
Aarhus C, Aarhus
Type
Office space
Office space in Tartu, Tartu (region)
 More info
Office space in Tartu, Tartu (region)
Office space for rent in Tartu, Tartu (region)
Areal
Ca. 15 m2
Pris pr. md.
Ca. 50 EUR pr md
Område
Tartu, Tartu (region)
Type
Office space
Warehouse in Haslev, Region Zealand
More info
Warehouse in Haslev, Region Zealand
Warehouse for rent in Haslev, Region Zealand
Areal
Ca. 270 m2
Pris pr. md.
Ca. 11,000 DKK pr md
Område
Haslev, Region Zealand
Type
Warehouse
Commercial space in Aalst, Oost-Vlaanderen
 More info
Commercial space in Aalst, Oost-Vlaanderen
Commercial space for rent in Aalst, Oost-Vlaanderen
Areal
-
Pris pr. md.
Ca. 2,100 EUR pr md
Område
Aalst, Oost-Vlaanderen
Type
Commercial property
Selected customers
30,000 customers use Companyspace.com
30,000 customers
285,000 companies in our database
2,400 rentals annually
Companyspace.com is used by thousands of landlords, property companies, commercial real estate agents, investors and business centres seeking greater visibility, more enquiries and lower vacancy rates.


