


Commercial premises for rent in Europe
There are 271,515 available commercial properties in Europe right now. Companyspace.com collects commercial properties from many different parts of the market, so that you as a company can more easily get an overview of available commercial properties in Europe.
Companyspace.com today:
New today 4
Updated 24h 1,178
Latest update 1 h ago
Active ads 358,354
271,515 company spaces found
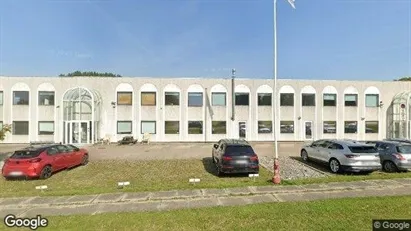
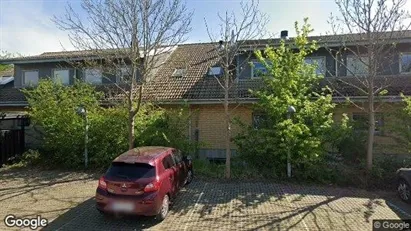
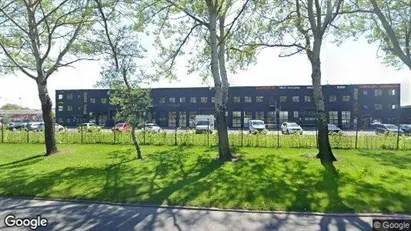
Office space in Jyllinge, Region Zealand
 More info
Office space in Jyllinge, Region Zealand
Office space for rent in Jyllinge, Region Zealand
Areal
Ca. 1,160 m2
Pris pr. md.
Ca. 57,150 DKK pr md
Område
Jyllinge, Region Zealand
Type
Office space
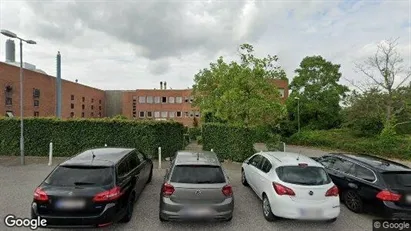
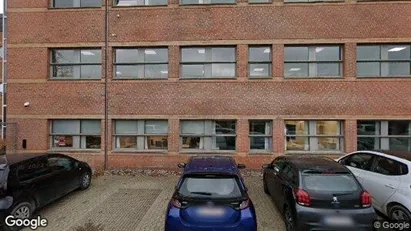
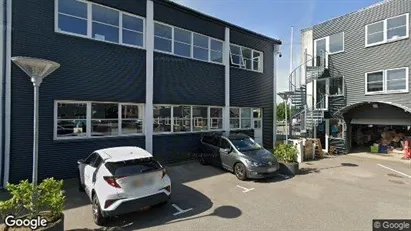
Office space in Herlev, Greater Copenhagen
 More info
Office space in Herlev, Greater Copenhagen
Office space for rent in Herlev, Greater Copenhagen
Areal
Ca. 140 m2
Pris pr. md.
Ca. 8,300 DKK pr md
Område
Herlev, Greater Copenhagen
Type
Office space
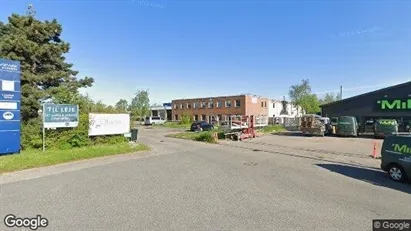
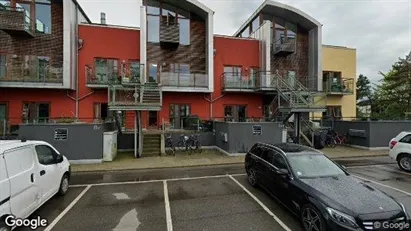
Office space in Hvidovre, Greater Copenhagen
 More info
Office space in Hvidovre, Greater Copenhagen
Office space for rent in Hvidovre, Greater Copenhagen
Areal
Ca. 515 m2
Pris pr. md.
Ca. 32,150 DKK pr md
Område
Hvidovre, Greater Copenhagen
Type
Office space
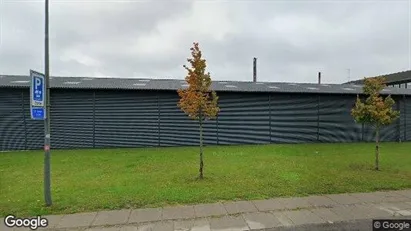
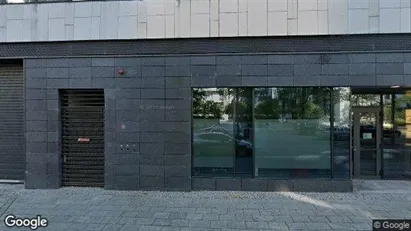
Warehouse in Herlev, Greater Copenhagen
 More info
Warehouse in Herlev, Greater Copenhagen
Warehouse for rent in Herlev, Greater Copenhagen
Areal
Ca. 795 m2
Pris pr. md.
Ca. 43,150 DKK pr md
Område
Herlev, Greater Copenhagen
Type
Warehouse
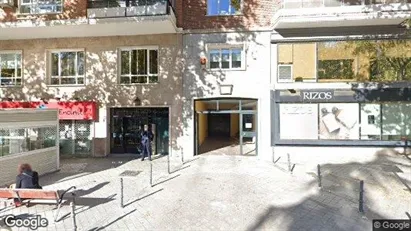
Commercial space in Madrid Chamartín, Madrid
 More info
Commercial space in Madrid Chamartín, Madrid
Commercial space for rent in Madrid Chamartín, Madrid
Areal
Ca. 35 m2
Pris pr. md.
Ca. 250 EUR pr md
Område
Madrid Chamartín, Madrid
Type
Commercial property
Office space in Glostrup, Greater Copenhagen
 More info
Office space in Glostrup, Greater Copenhagen
Office space for rent in Glostrup, Greater Copenhagen
Areal
Ca. 970 m2
Pris pr. md.
Ca. 44,400 DKK pr md
Område
Glostrup, Greater Copenhagen
Type
Office space
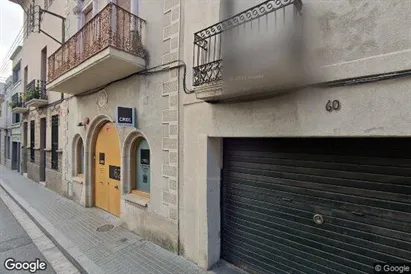
Commercial space in Sabadell, Cataluña
 More info
Commercial space in Sabadell, Cataluña
Commercial space for rent in Sabadell, Cataluña
Areal
Ca. 140 m2
Pris pr. md.
Ca. 150 EUR pr md
Område
Sabadell, Cataluña
Type
Commercial property
Office space in Skovlunde, Greater Copenhagen
 More info
Office space in Skovlunde, Greater Copenhagen
Office space for rent in Skovlunde, Greater Copenhagen
Areal
Ca. 685 m2
Pris pr. md.
Ca. 52,650 DKK pr md
Område
Skovlunde, Greater Copenhagen
Type
Office space
Warehouse in Skovlunde, Greater Copenhagen
 More info
Warehouse in Skovlunde, Greater Copenhagen
Warehouse for rent in Skovlunde, Greater Copenhagen
Areal
Ca. 335 m2
Pris pr. md.
Ca. 18,800 DKK pr md
Område
Skovlunde, Greater Copenhagen
Type
Warehouse
Office space in Glostrup, Greater Copenhagen
 More info
Office space in Glostrup, Greater Copenhagen
Office space for rent in Glostrup, Greater Copenhagen
Areal
Ca. 495 m2
Pris pr. md.
Ca. 28,800 DKK pr md
Område
Glostrup, Greater Copenhagen
Type
Office space
Office space in Albertslund, Greater Copenhagen
 More info
Office space in Albertslund, Greater Copenhagen
Office space for rent in Albertslund, Greater Copenhagen
Areal
Ca. 490 m2
Pris pr. md.
Ca. 34,700 DKK pr md
Område
Albertslund, Greater Copenhagen
Type
Office space
Office space in Herlev, Greater Copenhagen
 More info
Office space in Herlev, Greater Copenhagen
Office space for rent in Herlev, Greater Copenhagen
Areal
Ca. 335 m2
Pris pr. md.
Ca. 22,400 DKK pr md
Område
Herlev, Greater Copenhagen
Type
Office space
Office space in Birkerød, North Zealand
 More info
Office space in Birkerød, North Zealand
Office space for rent in Birkerød, North Zealand
Areal
Ca. 615 m2
Pris pr. md.
Ca. 41,150 DKK pr md
Område
Birkerød, North Zealand
Type
Office space
Office space in Copenhagen S, Copenhagen
 More info
Office space in Copenhagen S, Copenhagen
Office space for rent in Copenhagen S, Copenhagen
Areal
Ca. 1,380 m2
Pris pr. md.
Ca. 155,500 DKK pr md
Område
Copenhagen S, Copenhagen
Type
Office space
Office space in Stad Antwerp, Antwerp
 More info
Office space in Stad Antwerp, Antwerp
Office space for rent in Stad Antwerp, Antwerp
Areal
Ca. 160 m2
Pris pr. md.
Ca. 2,250 EUR pr md
Område
Stad Antwerp, Antwerp
Type
Office space
Office space in Skovlunde, Greater Copenhagen
 More info
Office space in Skovlunde, Greater Copenhagen
Office space for rent in Skovlunde, Greater Copenhagen
Areal
Ca. 280 m2
Pris pr. md.
Ca. 21,600 DKK pr md
Område
Skovlunde, Greater Copenhagen
Type
Office space
Office space in Skovlunde, Greater Copenhagen
 More info
Office space in Skovlunde, Greater Copenhagen
Office space for rent in Skovlunde, Greater Copenhagen
Areal
Ca. 975 m2
Pris pr. md.
Ca. 75,300 DKK pr md
Område
Skovlunde, Greater Copenhagen
Type
Office space
Commercial space in Falun, Dalarna
 More info
Commercial space in Falun, Dalarna
Commercial space for rent in Falun, Dalarna
Areal
Ca. 10 m2
Pris pr. md.
Ca. 800 SEK pr md
Område
Falun, Dalarna
Type
Commercial property
Selected customers
30,000 customers use Companyspace.com
30,000 customers
285,000 companies in our database
2,400 rentals annually
Companyspace.com is used by thousands of landlords, property companies, commercial real estate agents, investors and business centres seeking greater visibility, more enquiries and lower vacancy rates.


