


Commercial premises for rent in Europe
There are 283,574 available commercial properties in Europe right now. Companyspace.com collects commercial properties from many different parts of the market, so that you as a company can more easily get an overview of available commercial properties in Europe.
Companyspace.com today:
New today 139
Updated 24h 167
Notifications about new companyspaces2,196
Copenhagen +4
Stockholm +1
Berlin +8
Vienna +4
Paris +3
Dublin (county) +2
Latest update 3 h ago
Active ads 370,803
283,574 company spaces found
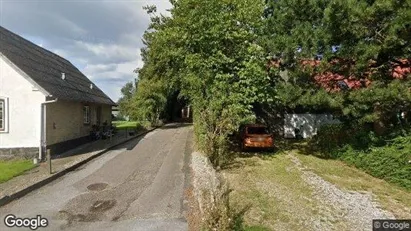
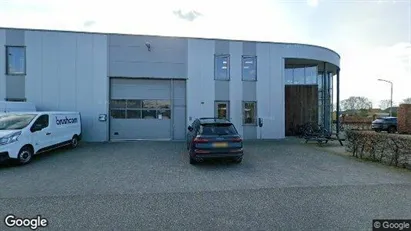
Industrial property in Nordborg, Region of Southern Denmark
 More info
Industrial property in Nordborg, Region of Southern Denmark
Industrial property for rent in Nordborg, Region of Southern Denmark
Areal
Ca. 370 m2
Pris pr. md.
Ca. 6,150 DKK pr md
Område
Nordborg, Region of Southern Denmark
Type
Industrial property
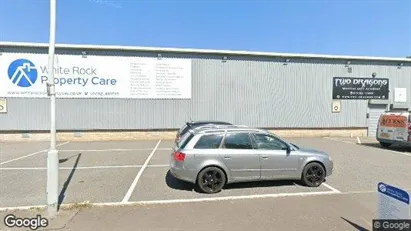
Industrial property in Swansea - West Glamorgan, Swansea (Region)
 More info
Industrial property in Swansea - West Glamorgan, Swansea (Region)
Production for rent in Swansea - West Glamorgan, Swansea (Region)
Areal
-
Pris pr. md.
Ca. 1,250 GBP pr md
Område
Swansea - West Glamorgan, Swansea (Region)
Type
Industrial property
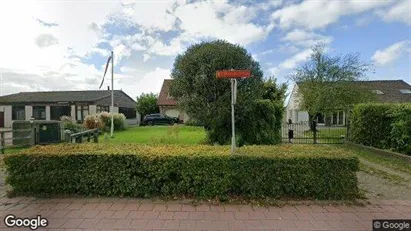
Commercial space in Oegstgeest, South Holland
 More info
Commercial space in Oegstgeest, South Holland
Commercial space for rent in Oegstgeest, South Holland
Areal
Ca. 35 m2
Pris pr. md.
Ca. 500 EUR pr md
Område
Oegstgeest, South Holland
Type
Commercial property
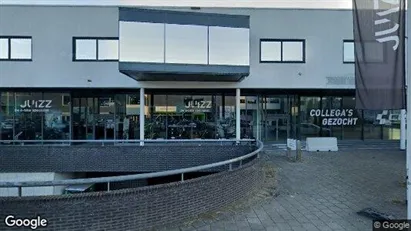
Office space in Nijmegen, Gelderland
 More info
Office space in Nijmegen, Gelderland
Office space for rent in Nijmegen, Gelderland
Areal
Ca. 30 m2
Pris pr. md.
Ca. 350 EUR pr md
Område
Nijmegen, Gelderland
Type
Office space
Office space in Nowosądecki, Małopolskie
 More info
Office space in Nowosądecki, Małopolskie
Office space for rent in Nowosądecki, Małopolskie
Areal
Ca. 200 m2
Pris pr. md.
Ca. 14,000 PLN pr md
Område
Nowosądecki, Małopolskie
Type
Office space
Office space in Nijmegen, Gelderland
 More info
Office space in Nijmegen, Gelderland
Office space for rent in Nijmegen, Gelderland
Areal
Ca. 50 m2
Pris pr. md.
Ca. 950 EUR pr md
Område
Nijmegen, Gelderland
Type
Office space
Office space in Leeuwarden, Friesland NL
 More info
Office space in Leeuwarden, Friesland NL
Office space for rent in Leeuwarden, Friesland NL
Areal
Ca. 40 m2
Pris pr. md.
Ca. 1,100 EUR pr md
Område
Leeuwarden, Friesland NL
Type
Office space
Office space in Horsens, Central Jutland Region
 More info
Office space in Horsens, Central Jutland Region
Office space for rent in Horsens, Central Jutland Region
Areal
Ca. 15 m2
Pris pr. md.
Ca. 2,300 DKK pr md
Område
Horsens, Central Jutland Region
Type
Office space
Office space in Amstelveen, North Holland
 More info
Office space in Amstelveen, North Holland
Office space for rent in Amstelveen, North Holland
Areal
Ca. 10 m2
Pris pr. md.
Ca. 100 EUR pr md
Område
Amstelveen, North Holland
Type
Office space
Office space in Alphen aan den Rijn, South Holland
 More info
Office space in Alphen aan den Rijn, South Holland
Office space for rent in Alphen aan den Rijn, South Holland
Areal
Ca. 500 m2
Pris pr. md.
Ca. 12,000 EUR pr md
Område
Alphen aan den Rijn, South Holland
Type
Office space
Commercial space in Oss, North Brabant
 More info
Commercial space in Oss, North Brabant
Commercial space for rent in Oss, North Brabant
Areal
Ca. 965 m2
Pris pr. md.
Ca. 6,000 EUR pr md
Område
Oss, North Brabant
Type
Commercial property
Office space in Amsterdam-Zuidoost, Amsterdam
 More info
Office space in Amsterdam-Zuidoost, Amsterdam
Office space for rent in Amsterdam-Zuidoost, Amsterdam
Areal
Ca. 80 m2
Pris pr. md.
Ca. 2,550 EUR pr md
Område
Amsterdam-Zuidoost, Amsterdam
Type
Office space
Commercial space in Turku, Varsinais-Suomi
 More info
Commercial space in Turku, Varsinais-Suomi
Commercial space for rent in Turku, Varsinais-Suomi
Areal
Ca. 70 m2
Pris pr. md.
Not stated
Område
Turku, Varsinais-Suomi
Type
Commercial property
Commercial space in Oosterhout, North Brabant
 More info
Commercial space in Oosterhout, North Brabant
Commercial space for rent in Oosterhout, North Brabant
Areal
Ca. 125 m2
Pris pr. md.
Ca. 238,500 EUR pr md
Område
Oosterhout, North Brabant
Type
Commercial property
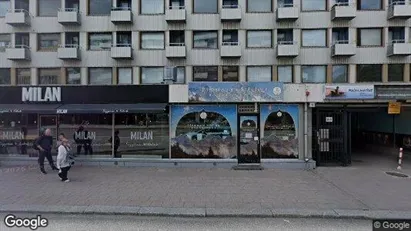
Office space in Amsterdam Centrum, Amsterdam
 More info
Office space in Amsterdam Centrum, Amsterdam
Office space for rent in Amsterdam Centrum, Amsterdam
Areal
Ca. 240 m2
Pris pr. md.
Not stated
Område
Amsterdam Centrum, Amsterdam
Type
Office space
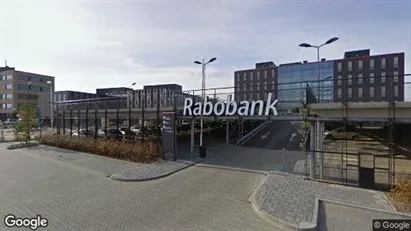
Commercial space in Den Bosch, North Brabant
 More info
Commercial space in Den Bosch, North Brabant
Commercial space for rent in Den Bosch, North Brabant
Areal
Ca. 910 m2
Pris pr. md.
Ca. 7,100 EUR pr md
Område
Den Bosch, North Brabant
Type
Commercial property
Office space in Copenhagen K, Copenhagen
More info
Office space in Copenhagen K, Copenhagen
Office space for rent in Copenhagen K, Copenhagen
Areal
Ca. 280 m2
Pris pr. md.
Ca. 378,300 DKK pr md
Område
Copenhagen K, Copenhagen
Type
Office space
Office space in Rotterdam Prins Alexander, Rotterdam
 More info
Office space in Rotterdam Prins Alexander, Rotterdam
Office space for rent in Rotterdam Prins Alexander, Rotterdam
Areal
Ca. 60 m2
Pris pr. md.
Ca. 700 EUR pr md
Område
Rotterdam Prins Alexander, Rotterdam
Type
Office space
Selected customers
30,000 customers use Companyspace.com
30,000 customers
285,000 companies in our database
2,400 rentals annually
Companyspace.com is used by thousands of landlords, property companies, commercial real estate agents, investors and business centres seeking greater visibility, more enquiries and lower vacancy rates.


