


Commercial premises for rent in Europe
There are 274,216 available commercial properties in Europe right now. Companyspace.com collects commercial properties from many different parts of the market, so that you as a company can more easily get an overview of available commercial properties in Europe.
Companyspace.com today:
New today 881
Updated 24h 1,447
Notifications about new companyspaces1,825
Copenhagen +3
Amsterdam +17
Berlin +14
Brussels +2
Vienna +14
Dublin (county) +44
Warsaw +45
Latest update 13 min ago
Active ads 360,316
274,216 company spaces found
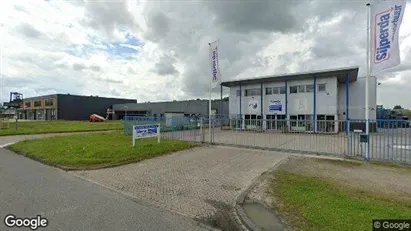
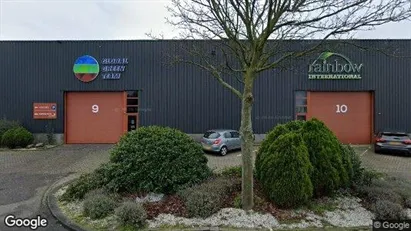
Commercial space in Pijnacker-Nootdorp, South Holland
 More info
Commercial space in Pijnacker-Nootdorp, South Holland
Commercial space for rent in Pijnacker-Nootdorp, South Holland
Areal
Ca. 455 m2
Pris pr. md.
Ca. 3,000 EUR pr md
Område
Pijnacker-Nootdorp, South Holland
Type
Commercial property
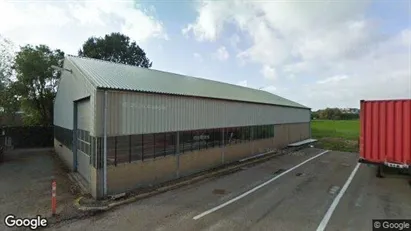
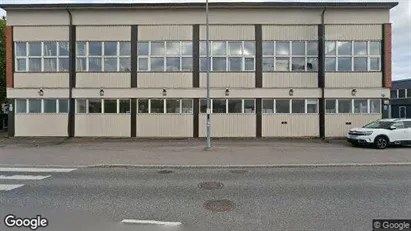
Industrial property in Helsinki Keskinen, Helsinki
 More info
Industrial property in Helsinki Keskinen, Helsinki
Industrial property for rent in Helsinki Keskinen, Helsinki
Areal
Ca. 590 m2
Pris pr. md.
Ca. 3,950 EUR pr md
Område
Helsinki Keskinen, Helsinki
Type
Industrial property
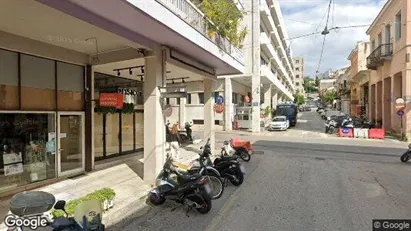
Commercial space in Patras, Western Greece
 More info
Commercial space in Patras, Western Greece
Commercial space for rent in Patras, Western Greece
Areal
Ca. 25 m2
Pris pr. md.
Ca. 300 EUR pr md
Område
Patras, Western Greece
Type
Commercial property
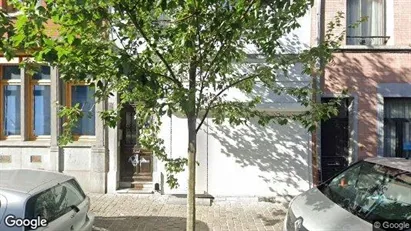
Office space in Stad Brussel, Brussels
 More info
Office space in Stad Brussel, Brussels
Office space for rent in Stad Brussel, Brussels
Areal
Ca. 35 m2
Pris pr. md.
Ca. 900 EUR pr md
Område
Stad Brussel, Brussels
Type
Office space
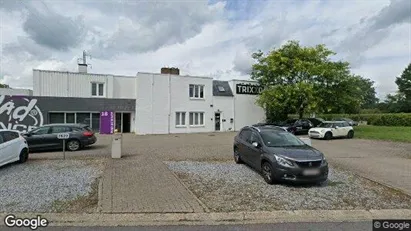
Showroom in Beringen, Limburg
 More info
Showroom in Beringen, Limburg
Showroom for rent in Beringen, Limburg
Areal
Ca. 830 m2
Pris pr. md.
Ca. 3,500 EUR pr md
Område
Beringen, Limburg
Type
Showroom
Commercial space in Sjöbo, Skåne County
 More info
Commercial space in Sjöbo, Skåne County
Commercial space for rent in Sjöbo, Skåne County
Areal
Ca. 85 m2
Pris pr. md.
Ca. 12,900 SEK pr md
Område
Sjöbo, Skåne County
Type
Commercial property
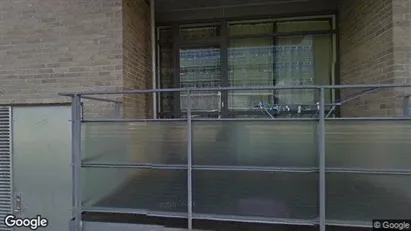
Commercial space in Copenhagen S, Copenhagen
 More info
Commercial space in Copenhagen S, Copenhagen
Commercial space for rent in Copenhagen S, Copenhagen
Areal
-
Pris pr. md.
Not stated
Område
Copenhagen S, Copenhagen
Type
Commercial property
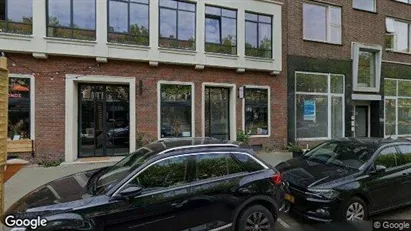
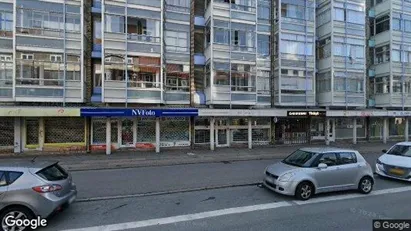
Office space in Rotterdam Centrum, Rotterdam
 More info
Office space in Rotterdam Centrum, Rotterdam
Office space for rent in Rotterdam Centrum, Rotterdam
Areal
Ca. 75 m2
Pris pr. md.
Not stated
Område
Rotterdam Centrum, Rotterdam
Type
Office space
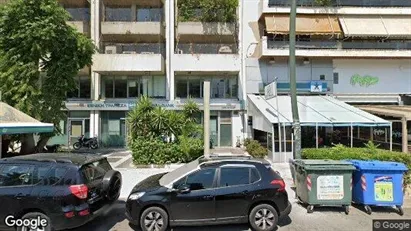
Office space in Kallithea, Attica
 More info
Office space in Kallithea, Attica
Office space for rent in Kallithea, Attica
Areal
-
Pris pr. md.
Not stated
Område
Kallithea, Attica
Type
Office space
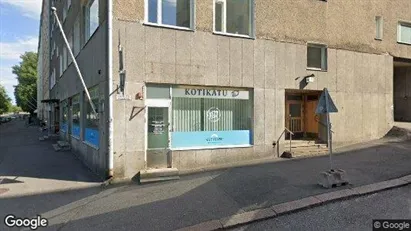
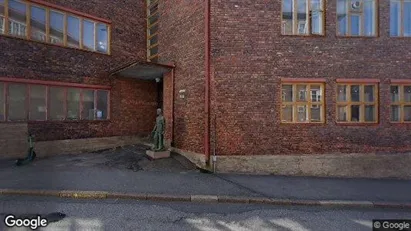
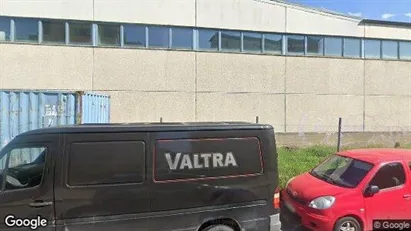
Industrial property in Helsinki Keskinen, Helsinki
 More info
Industrial property in Helsinki Keskinen, Helsinki
Industrial property for rent in Helsinki Keskinen, Helsinki
Areal
Ca. 500 m2
Pris pr. md.
Ca. 5,500 EUR pr md
Område
Helsinki Keskinen, Helsinki
Type
Industrial property
Commercial space in Leeuwarden, Friesland NL
 More info
Commercial space in Leeuwarden, Friesland NL
Commercial space for rent in Leeuwarden, Friesland NL
Areal
-
Pris pr. md.
Ca. 400 EUR pr md
Område
Leeuwarden, Friesland NL
Type
Commercial property
Office space in Karlstad, Värmland County
More info
Office space in Karlstad, Värmland County
Office space for rent in Karlstad, Värmland County
Areal
Ca. 10 m2
Pris pr. md.
Ca. 6,000 SEK pr md
Område
Karlstad, Värmland County
Type
Office space
Office space in Piraeus, Attica
 More info
Office space in Piraeus, Attica
Office space for rent in Piraeus, Attica
Areal
-
Pris pr. md.
Not stated
Område
Piraeus, Attica
Type
Office space
Industrial property in Helsinki Kaakkoinen, Helsinki
 More info
Industrial property in Helsinki Kaakkoinen, Helsinki
Industrial property for rent in Helsinki Kaakkoinen, Helsinki
Areal
Ca. 250 m2
Pris pr. md.
Ca. 3,000 EUR pr md
Område
Helsinki Kaakkoinen, Helsinki
Type
Industrial property
Office space in Copenhagen NV, Copenhagen
 More info
Office space in Copenhagen NV, Copenhagen
Office space for rent in Copenhagen NV, Copenhagen
Areal
Ca. 215 m2
Pris pr. md.
Not stated
Område
Copenhagen NV, Copenhagen
Type
Office space
Industrial property in Helsinki Koillinen, Helsinki
 More info
Industrial property in Helsinki Koillinen, Helsinki
Industrial property for rent in Helsinki Koillinen, Helsinki
Areal
Ca. 185 m2
Pris pr. md.
Ca. 1,350 EUR pr md
Område
Helsinki Koillinen, Helsinki
Type
Industrial property
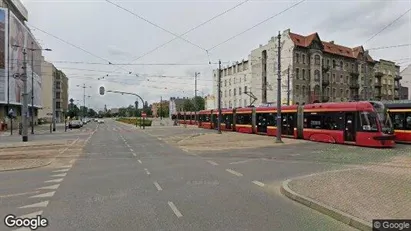
Commercial space in Łódź, Łódzkie
 More info
Commercial space in Łódź, Łódzkie
Commercial space for rent in Łódź, Łódzkie
Areal
Ca. 155 m2
Pris pr. md.
Ca. 9,250 PLN pr md
Område
Łódź, Łódzkie
Type
Commercial property
Commercial space in Westland, South Holland
 More info
Commercial space in Westland, South Holland
Commercial space for rent in Westland, South Holland
Areal
Ca. 3,935 m2
Pris pr. md.
Ca. 38,250 EUR pr md
Område
Westland, South Holland
Type
Commercial property
Selected customers
30,000 customers use Companyspace.com
30,000 customers
285,000 companies in our database
2,400 rentals annually
Companyspace.com is used by thousands of landlords, property companies, commercial real estate agents, investors and business centres seeking greater visibility, more enquiries and lower vacancy rates.


