


Commercial premises for rent in Europe
There are 283,574 available commercial properties in Europe right now. Companyspace.com collects commercial properties from many different parts of the market, so that you as a company can more easily get an overview of available commercial properties in Europe.
Companyspace.com today:
New today 139
Updated 24h 177
Notifications about new companyspaces2,196
Copenhagen +4
Stockholm +1
Berlin +8
Vienna +4
Paris +3
Dublin (county) +2
Latest update 2 h ago
Active ads 370,803
283,574 company spaces found
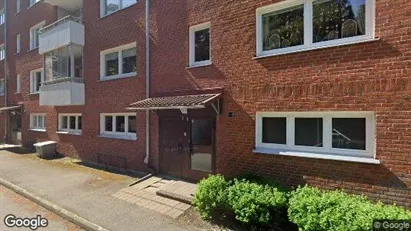
Commercial space in Uppsala, Uppsala County
 More info
Commercial space in Uppsala, Uppsala County
Commercial space for rent in Uppsala, Uppsala County
Areal
Ca. 5 m2
Pris pr. md.
Ca. 250 SEK pr md
Område
Uppsala, Uppsala County
Type
Commercial property
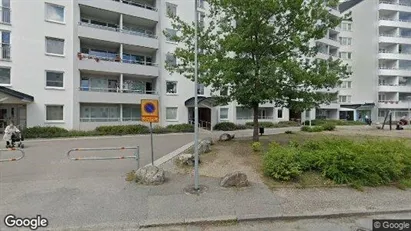
Commercial space in Södertälje, Stockholm County
 More info
Commercial space in Södertälje, Stockholm County
Commercial space for rent in Södertälje, Stockholm County
Areal
-
Pris pr. md.
Ca. 6,900 SEK pr md
Område
Södertälje, Stockholm County
Type
Commercial property
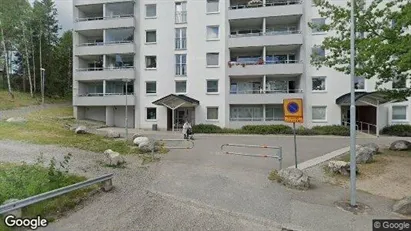
Commercial space in Södertälje, Stockholm County
 More info
Commercial space in Södertälje, Stockholm County
Commercial space for rent in Södertälje, Stockholm County
Areal
Ca. 10 m2
Pris pr. md.
Ca. 500 SEK pr md
Område
Södertälje, Stockholm County
Type
Commercial property
Office space in Vejle, Vejle (region)
 More info
Office space in Vejle, Vejle (region)
Office space for rent in Vejle, Vejle (region)
Areal
Ca. 1,015 m2
Pris pr. md.
Ca. 36,600 DKK pr md
Område
Vejle, Vejle (region)
Type
Office space
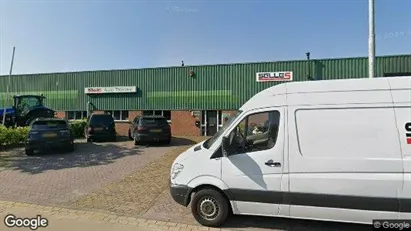
Commercial space in Midden-Drenthe, Drenthe
 More info
Commercial space in Midden-Drenthe, Drenthe
Commercial space for rent in Midden-Drenthe, Drenthe
Areal
Ca. 2,080 m2
Pris pr. md.
Ca. 5,500 EUR pr md
Område
Midden-Drenthe, Drenthe
Type
Commercial property
Industrial property in Joensuu, Pohjois-Karjala
 More info
Industrial property in Joensuu, Pohjois-Karjala
Industrial property for rent in Joensuu, Pohjois-Karjala
Areal
Ca. 20 m2
Pris pr. md.
Ca. 100 EUR pr md
Område
Joensuu, Pohjois-Karjala
Type
Industrial property
Commercial space in Södertälje, Stockholm County
 More info
Commercial space in Södertälje, Stockholm County
Commercial space for rent in Södertälje, Stockholm County
Areal
Ca. 5 m2
Pris pr. md.
Ca. 150 SEK pr md
Område
Södertälje, Stockholm County
Type
Commercial property
Commercial space in Södertälje, Stockholm County
 More info
Commercial space in Södertälje, Stockholm County
Commercial space for rent in Södertälje, Stockholm County
Areal
Ca. 5 m2
Pris pr. md.
Ca. 200 SEK pr md
Område
Södertälje, Stockholm County
Type
Commercial property
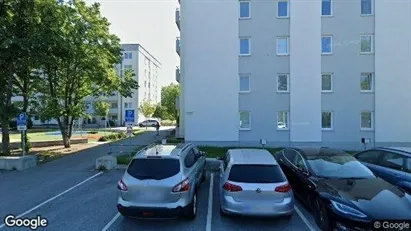
Office space in Skive, Central Jutland Region
 More info
Office space in Skive, Central Jutland Region
Office space for rent in Skive, Central Jutland Region
Areal
Ca. 570 m2
Pris pr. md.
Ca. 26,100 DKK pr md
Område
Skive, Central Jutland Region
Type
Office space
Commercial space in Södertälje, Stockholm County
 More info
Commercial space in Södertälje, Stockholm County
Commercial space for rent in Södertälje, Stockholm County
Areal
Ca. 5 m2
Pris pr. md.
Ca. 300 SEK pr md
Område
Södertälje, Stockholm County
Type
Commercial property
Commercial space in Södertälje, Stockholm County
 More info
Commercial space in Södertälje, Stockholm County
Commercial space for rent in Södertälje, Stockholm County
Areal
Ca. 5 m2
Pris pr. md.
Ca. 250 SEK pr md
Område
Södertälje, Stockholm County
Type
Commercial property
Commercial space in Södertälje, Stockholm County
 More info
Commercial space in Södertälje, Stockholm County
Commercial space for rent in Södertälje, Stockholm County
Areal
Ca. 10 m2
Pris pr. md.
Ca. 650 SEK pr md
Område
Södertälje, Stockholm County
Type
Commercial property
Commercial space in Södertälje, Stockholm County
 More info
Commercial space in Södertälje, Stockholm County
Commercial space for rent in Södertälje, Stockholm County
Areal
Ca. 5 m2
Pris pr. md.
Ca. 200 SEK pr md
Område
Södertälje, Stockholm County
Type
Commercial property
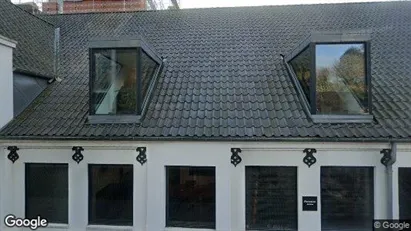
Office space in Aarhus C, Aarhus
 More info
Office space in Aarhus C, Aarhus
Office space for rent in Aarhus C, Aarhus
Areal
Ca. 350 m2
Pris pr. md.
Ca. 40,850 DKK pr md
Område
Aarhus C, Aarhus
Type
Office space
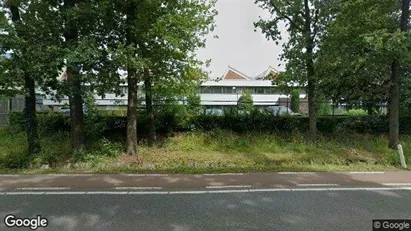
Office space in Beringen, Limburg
 More info
Office space in Beringen, Limburg
Office space for rent in Beringen, Limburg
Areal
Ca. 575 m2
Pris pr. md.
Ca. 4,050 EUR pr md
Område
Beringen, Limburg
Type
Office space
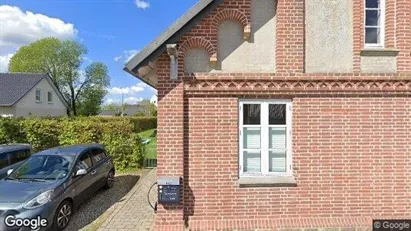
Office space in Silkeborg, Central Jutland Region
 More info
Office space in Silkeborg, Central Jutland Region
Office space for rent in Silkeborg, Central Jutland Region
Areal
Ca. 175 m2
Pris pr. md.
Ca. 15,000 DKK pr md
Område
Silkeborg, Central Jutland Region
Type
Office space
Commercial space in Södertälje, Stockholm County
 More info
Commercial space in Södertälje, Stockholm County
Commercial space for rent in Södertälje, Stockholm County
Areal
Ca. 15 m2
Pris pr. md.
Ca. 750 SEK pr md
Område
Södertälje, Stockholm County
Type
Commercial property
Commercial space in Södertälje, Stockholm County
 More info
Commercial space in Södertälje, Stockholm County
Commercial space for rent in Södertälje, Stockholm County
Areal
Ca. 5 m2
Pris pr. md.
Ca. 250 SEK pr md
Område
Södertälje, Stockholm County
Type
Commercial property
Selected customers
30,000 customers use Companyspace.com
30,000 customers
285,000 companies in our database
2,400 rentals annually
Companyspace.com is used by thousands of landlords, property companies, commercial real estate agents, investors and business centres seeking greater visibility, more enquiries and lower vacancy rates.


