


Shop for rent in Libin
These commercial premises are closest to your search
We currently have no available commercial premises registered that match your search exactly. Therefore, we show below the commercial premises that best match your search based on the current market.
The shown listings may differ from your original search in terms of, for example, premises type, location, size or price, but they have been selected because they may be relevant alternatives for your business.
Take a look at the suggestions below – or start your search again here.
Companyspace.com today:
New today 596
Updated 24h 1,335
Notifications about new companyspaces2,198
Copenhagen +3
Stockholm +4
Amsterdam +12
Berlin +1
Vienna +15
Paris +5
Dublin (county) +48
Warsaw +12
Greater London +6
Latest update 32 min ago
Active ads 369,531
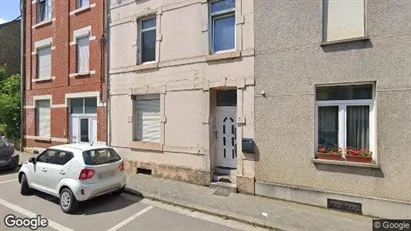
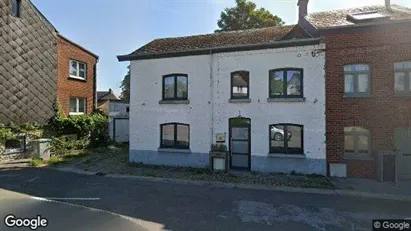
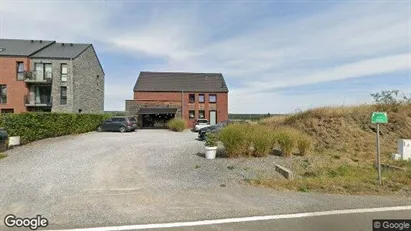
Commercial property in Marche-en-Famenne, Luxemburg (Provincie)
 More info
Commercial property in Marche-en-Famenne, Luxemburg (Provincie)
Commercial property for sale in Marche-en-Famenne, Luxemburg (Provincie)
Areal
Ca. 260 m2
Pris
Ca. 350,000EUR
Område
Marche-en-Famenne, Luxemburg (Provincie)
Type
Commercial property
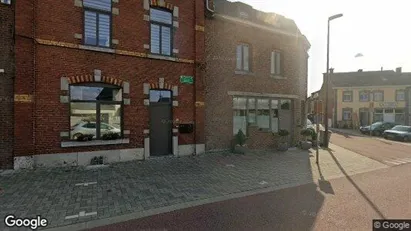
Commercial property in Aarlen, Luxemburg (Provincie)
 More info
Commercial property in Aarlen, Luxemburg (Provincie)
Commercial property for sale in Aarlen, Luxemburg (Provincie)
Areal
Ca. 175 m2
Pris
Ca. 260,000EUR
Område
Aarlen, Luxemburg (Provincie)
Type
Commercial property
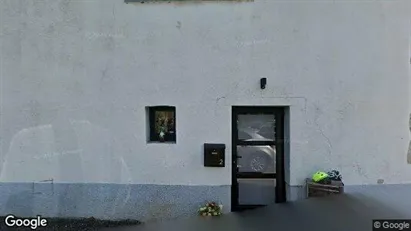
Commercial property in Bouillon, Luxemburg (Provincie)
 More info
Commercial property in Bouillon, Luxemburg (Provincie)
Commercial property for sale in Bouillon, Luxemburg (Provincie)
Areal
Ca. 220 m2
Pris
Ca. 159,000EUR
Område
Bouillon, Luxemburg (Provincie)
Type
Commercial property
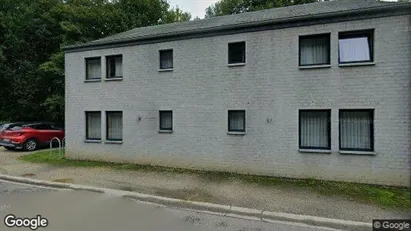
Commercial property in Aarlen, Luxemburg (Provincie)
 More info
Commercial property in Aarlen, Luxemburg (Provincie)
Commercial property for sale in Aarlen, Luxemburg (Provincie)
Areal
Ca. 200 m2
Pris
Ca. 180,000EUR
Område
Aarlen, Luxemburg (Provincie)
Type
Commercial property
Commercial property in Saint-Hubert, Luxemburg (Provincie)
 More info
Commercial property in Saint-Hubert, Luxemburg (Provincie)
Commercial property for sale in Saint-Hubert, Luxemburg (Provincie)
Areal
Ca. 125 m2
Pris
Ca. 100,000EUR
Område
Saint-Hubert, Luxemburg (Provincie)
Type
Commercial property
Commercial property in Marche-en-Famenne, Luxemburg (Provincie)
 More info
Commercial property in Marche-en-Famenne, Luxemburg (Provincie)
Commercial property for sale in Marche-en-Famenne, Luxemburg (Provincie)
Areal
-
Pris
Ca. 1,670,000EUR
Område
Marche-en-Famenne, Luxemburg (Provincie)
Type
Commercial property
Commercial property in Marche-en-Famenne, Luxemburg (Provincie)
 More info
Commercial property in Marche-en-Famenne, Luxemburg (Provincie)
Commercial property for sale in Marche-en-Famenne, Luxemburg (Provincie)
Areal
-
Pris
Ca. 140,000EUR
Område
Marche-en-Famenne, Luxemburg (Provincie)
Type
Commercial property
Warehouse property in Marche-en-Famenne, Luxemburg (Provincie)
 More info
Warehouse property in Marche-en-Famenne, Luxemburg (Provincie)
Warehouse for sale in Marche-en-Famenne, Luxemburg (Provincie)
Areal
Ca. 330 m2
Pris
Ca. 149,000EUR
Område
Marche-en-Famenne, Luxemburg (Provincie)
Type
Warehouse
Commercial property in Saint-Hubert, Luxemburg (Provincie)
 More info
Commercial property in Saint-Hubert, Luxemburg (Provincie)
Commercial property for sale in Saint-Hubert, Luxemburg (Provincie)
Areal
Ca. 2,530 m2
Pris
Ca. 1,950,000EUR
Område
Saint-Hubert, Luxemburg (Provincie)
Type
Commercial property
Commercial property in Marche-en-Famenne, Luxemburg (Provincie)
 More info
Commercial property in Marche-en-Famenne, Luxemburg (Provincie)
Commercial property for sale in Marche-en-Famenne, Luxemburg (Provincie)
Areal
Ca. 110 m2
Pris
Ca. 585,000EUR
Område
Marche-en-Famenne, Luxemburg (Provincie)
Type
Commercial property
Office property in Marche-en-Famenne, Luxemburg (Provincie)
 More info
Office property in Marche-en-Famenne, Luxemburg (Provincie)
Office space for sale in Marche-en-Famenne, Luxemburg (Provincie)
Areal
Ca. 110 m2
Pris
Ca. 585,000EUR
Område
Marche-en-Famenne, Luxemburg (Provincie)
Type
Office space
Commercial property in Bouillon, Luxemburg (Provincie)
 More info
Commercial property in Bouillon, Luxemburg (Provincie)
Commercial property for sale in Bouillon, Luxemburg (Provincie)
Areal
Ca. 125 m2
Pris
Ca. 160,000EUR
Område
Bouillon, Luxemburg (Provincie)
Type
Commercial property
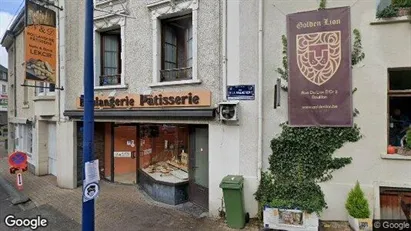
Commercial property in Florenville, Luxemburg (Provincie)
 More info
Commercial property in Florenville, Luxemburg (Provincie)
Commercial property for sale in Florenville, Luxemburg (Provincie)
Areal
-
Pris
Ca. 695,000EUR
Område
Florenville, Luxemburg (Provincie)
Type
Commercial property
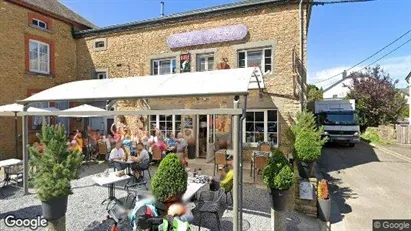
Commercial property in Durbuy, Luxemburg (Provincie)
 More info
Commercial property in Durbuy, Luxemburg (Provincie)
Commercial property for sale in Durbuy, Luxemburg (Provincie)
Areal
Ca. 310 m2
Pris
Ca. 315,000EUR
Område
Durbuy, Luxemburg (Provincie)
Type
Commercial property
Commercial property in Vielsalm, Luxemburg (Provincie)
 More info
Commercial property in Vielsalm, Luxemburg (Provincie)
Commercial property for sale in Vielsalm, Luxemburg (Provincie)
Areal
Ca. 85 m2
Pris
Ca. 195,000EUR
Område
Vielsalm, Luxemburg (Provincie)
Type
Commercial property
Office property in La Roche-en-Ardenne, Luxemburg (Provincie)
 More info
Office property in La Roche-en-Ardenne, Luxemburg (Provincie)
Office space for sale in La Roche-en-Ardenne, Luxemburg (Provincie)
Areal
Ca. 460 m2
Pris
Ca. 335,000EUR
Område
La Roche-en-Ardenne, Luxemburg (Provincie)
Type
Office space
Commercial property in Chiny, Luxemburg (Provincie)
 More info
Commercial property in Chiny, Luxemburg (Provincie)
Commercial property for sale in Chiny, Luxemburg (Provincie)
Areal
Ca. 300 m2
Pris
Ca. 495,000EUR
Område
Chiny, Luxemburg (Provincie)
Type
Commercial property
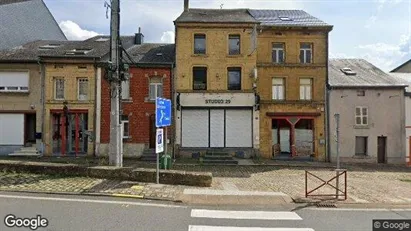
Commercial property in Virton, Luxemburg (Provincie)
 More info
Commercial property in Virton, Luxemburg (Provincie)
Commercial property for sale in Virton, Luxemburg (Provincie)
Areal
Ca. 5 m2
Pris
Ca. 295,000EUR
Område
Virton, Luxemburg (Provincie)
Type
Commercial property
Selected customers
30,000 customers use Companyspace.com
30,000 customers
285,000 companies in our database
2,400 rentals annually
Companyspace.com is used by thousands of landlords, property companies, commercial real estate agents, investors and business centres seeking greater visibility, more enquiries and lower vacancy rates.


