


Shop for rent in Kortenberg
These commercial premises are closest to your search
We currently have no available commercial premises registered that match your search exactly. Therefore, we show below the commercial premises that best match your search based on the current market.
The shown listings may differ from your original search in terms of, for example, premises type, location, size or price, but they have been selected because they may be relevant alternatives for your business.
Take a look at the suggestions below – or start your search again here.
Companyspace.com today:
New today 61
Updated 24h 1,166
Notifications about new companyspaces2,009
Copenhagen +4
Stockholm +2
Vienna +15
Roma (region) +1
Latest update 3 h ago
Active ads 371,259
Restaurant in Leuven, Vlaams-Brabant
More info
We monitor the market!
Restaurant in Leuven, Vlaams-Brabant
Deze is 9 j een frituur geweest heeft nu wel wat opknap werk nodig waar ik als verhuurder wel wil instaan voor keuring eletriciteit en verwarming
Areal
Ca. 55 m2
Pris pr. md.
Ca. 100 EUR pr md
Område
Leuven, Vlaams-Brabant
Type
Restaurant
Commercial space in Grimbergen, Vlaams-Brabant
 More info
Commercial space in Grimbergen, Vlaams-Brabant
Commercial space for rent in Grimbergen, Vlaams-Brabant
Areal
-
Pris pr. md.
Ca. 4,900 EUR pr md
Område
Grimbergen, Vlaams-Brabant
Type
Commercial property
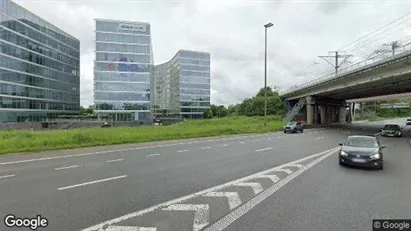
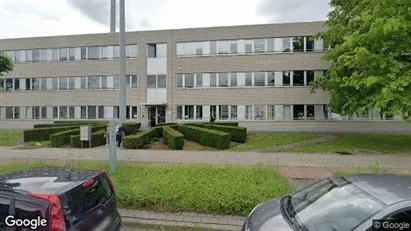
Office space in Zaventem, Vlaams-Brabant
 More info
Office space in Zaventem, Vlaams-Brabant
Office space for rent in Zaventem, Vlaams-Brabant
Areal
469 - 1,824 m2
Pris pr. md.
Ca. 5,850 EUR pr md
Område
Zaventem, Vlaams-Brabant
Type
Office space
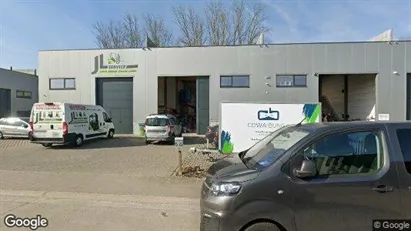
Commercial space in Ternat, Vlaams-Brabant
 More info
Commercial space in Ternat, Vlaams-Brabant
Commercial space for rent in Ternat, Vlaams-Brabant
Areal
-
Pris pr. md.
Ca. 1,450 EUR pr md
Område
Ternat, Vlaams-Brabant
Type
Commercial property
Commercial property in Affligem, Vlaams-Brabant
 More info
Commercial property in Affligem, Vlaams-Brabant
Commercial property for sale in Affligem, Vlaams-Brabant
Areal
Ca. 220 m2
Pris
Ca. 495,000EUR
Område
Affligem, Vlaams-Brabant
Type
Commercial property
Commercial property in Machelen, Vlaams-Brabant
 More info
Commercial property in Machelen, Vlaams-Brabant
Commercial property for sale in Machelen, Vlaams-Brabant
Areal
Ca. 20 m2
Pris
Ca. 185,000EUR
Område
Machelen, Vlaams-Brabant
Type
Commercial property
Commercial property in Affligem, Vlaams-Brabant
 More info
Commercial property in Affligem, Vlaams-Brabant
Commercial property for sale in Affligem, Vlaams-Brabant
Areal
-
Pris
Ca. 485,000EUR
Område
Affligem, Vlaams-Brabant
Type
Commercial property
Office space in Dilbeek, Vlaams-Brabant
 More info
Office space in Dilbeek, Vlaams-Brabant
Office space for rent in Dilbeek, Vlaams-Brabant
Areal
-
Pris pr. md.
Ca. 2,800 EUR pr md
Område
Dilbeek, Vlaams-Brabant
Type
Office space
Commercial property in Boortmeerbeek, Vlaams-Brabant
 More info
Commercial property in Boortmeerbeek, Vlaams-Brabant
Commercial property for sale in Boortmeerbeek, Vlaams-Brabant
Areal
Ca. 360 m2
Pris
Ca. 1,100,000EUR
Område
Boortmeerbeek, Vlaams-Brabant
Type
Commercial property
Commercial property in Kapelle-op-den-Bos, Vlaams-Brabant
 More info
Commercial property in Kapelle-op-den-Bos, Vlaams-Brabant
Commercial property for sale in Kapelle-op-den-Bos, Vlaams-Brabant
Areal
Ca. 430 m2
Pris
Ca. 661,000EUR
Område
Kapelle-op-den-Bos, Vlaams-Brabant
Type
Commercial property
Commercial property in Tienen, Vlaams-Brabant
 More info
Commercial property in Tienen, Vlaams-Brabant
Commercial property for sale in Tienen, Vlaams-Brabant
Areal
Ca. 135 m2
Pris
Ca. 199,000EUR
Område
Tienen, Vlaams-Brabant
Type
Commercial property
Office property in Lubbeek, Vlaams-Brabant
 More info
Office property in Lubbeek, Vlaams-Brabant
Office space for sale in Lubbeek, Vlaams-Brabant
Areal
Ca. 90 m2
Pris
Ca. 382,000EUR
Område
Lubbeek, Vlaams-Brabant
Type
Office space
Commercial property in Halle, Vlaams-Brabant
 More info
Commercial property in Halle, Vlaams-Brabant
Commercial property for sale in Halle, Vlaams-Brabant
Areal
-
Pris
Ca. 279,000EUR
Område
Halle, Vlaams-Brabant
Type
Commercial property
Office space in Liedekerke, Vlaams-Brabant
 More info
Office space in Liedekerke, Vlaams-Brabant
Office space for rent in Liedekerke, Vlaams-Brabant
Areal
-
Pris pr. md.
Ca. 1,600 EUR pr md
Område
Liedekerke, Vlaams-Brabant
Type
Office space
Commercial space in Ternat, Vlaams-Brabant
 More info
Commercial space in Ternat, Vlaams-Brabant
Commercial space for rent in Ternat, Vlaams-Brabant
Areal
-
Pris pr. md.
Ca. 2,500 EUR pr md
Område
Ternat, Vlaams-Brabant
Type
Commercial property
Commercial space in Kortenaken, Vlaams-Brabant
 More info
Commercial space in Kortenaken, Vlaams-Brabant
Commercial space for rent in Kortenaken, Vlaams-Brabant
Areal
Ca. 5 m2
Pris pr. md.
Ca. 900 EUR pr md
Område
Kortenaken, Vlaams-Brabant
Type
Commercial property
Office space in Vilvoorde, Vlaams-Brabant
 More info
Office space in Vilvoorde, Vlaams-Brabant
Office space for rent in Vilvoorde, Vlaams-Brabant
Areal
Ca. 440 m2
Pris pr. md.
Ca. 3,850 EUR pr md
Område
Vilvoorde, Vlaams-Brabant
Type
Office space
Office property in Grimbergen, Vlaams-Brabant
 More info
Office property in Grimbergen, Vlaams-Brabant
Office space for sale in Grimbergen, Vlaams-Brabant
Areal
Ca. 80 m2
Pris
Ca. 160,000EUR
Område
Grimbergen, Vlaams-Brabant
Type
Office space
Selected customers
30,000 customers use Companyspace.com
30,000 customers
285,000 companies in our database
2,400 rentals annually
Companyspace.com is used by thousands of landlords, property companies, commercial real estate agents, investors and business centres seeking greater visibility, more enquiries and lower vacancy rates.


