


Shop for rent in Kasteelbrakel
These commercial premises are closest to your search
We currently have no available commercial premises registered that match your search exactly. Therefore, we show below the commercial premises that best match your search based on the current market.
The shown listings may differ from your original search in terms of, for example, premises type, location, size or price, but they have been selected because they may be relevant alternatives for your business.
Take a look at the suggestions below – or start your search again here.
Companyspace.com today:
New today 1,124
Updated 24h 1,130
Notifications about new companyspaces1,914
Copenhagen +4
Stockholm +3
Berlin +19
Oslo +1
Brussels +5
Warsaw +13
Latest update 1 min ago
Active ads 316,589
Office space in Ottignies-Louvain-la-Neuve, Waals-Brabant
 More info
Office space in Ottignies-Louvain-la-Neuve, Waals-Brabant
Office space for rent in Ottignies-Louvain-la-Neuve, Waals-Brabant
Areal
Ca. 910 m2
Pris pr. md.
Ca. 11,400 EUR pr md
Område
Ottignies-Louvain-la-Neuve, Waals-Brabant
Type
Office space
Office space in Tubeke, Waals-Brabant
 More info
Office space in Tubeke, Waals-Brabant
Office space for rent in Tubeke, Waals-Brabant
Areal
Ca. 550 m2
Pris pr. md.
Ca. 7,400 EUR pr md
Område
Tubeke, Waals-Brabant
Type
Office space
Office space in Ottignies-Louvain-la-Neuve, Waals-Brabant
 More info
Office space in Ottignies-Louvain-la-Neuve, Waals-Brabant
Office space for rent in Ottignies-Louvain-la-Neuve, Waals-Brabant
Areal
Ca. 455 m2
Pris pr. md.
Ca. 5,700 EUR pr md
Område
Ottignies-Louvain-la-Neuve, Waals-Brabant
Type
Office space
Office space in Eigenbrakel, Waals-Brabant
 More info
Office space in Eigenbrakel, Waals-Brabant
Office space for rent in Eigenbrakel, Waals-Brabant
Areal
Ca. 10 m2
Pris pr. md.
Ca. 150 EUR pr md
Område
Eigenbrakel, Waals-Brabant
Type
Office space
Office space in Eigenbrakel, Waals-Brabant
 More info
Office space in Eigenbrakel, Waals-Brabant
Office space for rent in Eigenbrakel, Waals-Brabant
Areal
Ca. 735 m2
Pris pr. md.
Ca. 10,100 EUR pr md
Område
Eigenbrakel, Waals-Brabant
Type
Office space
Office space in Mont-Saint-Guibert, Waals-Brabant
 More info
Office space in Mont-Saint-Guibert, Waals-Brabant
Office space for rent in Mont-Saint-Guibert, Waals-Brabant
Areal
Ca. 15 m2
Pris pr. md.
Ca. 700 EUR pr md
Område
Mont-Saint-Guibert, Waals-Brabant
Type
Office space
Office space in Mont-Saint-Guibert, Waals-Brabant
 More info
Office space in Mont-Saint-Guibert, Waals-Brabant
Office space for rent in Mont-Saint-Guibert, Waals-Brabant
Areal
Ca. 5 m2
Pris pr. md.
Ca. 150 EUR pr md
Område
Mont-Saint-Guibert, Waals-Brabant
Type
Office space
Office space in Mont-Saint-Guibert, Waals-Brabant
 More info
Office space in Mont-Saint-Guibert, Waals-Brabant
Office space for rent in Mont-Saint-Guibert, Waals-Brabant
Areal
Ca. 465 m2
Pris pr. md.
Ca. 5,800 EUR pr md
Område
Mont-Saint-Guibert, Waals-Brabant
Type
Office space
Office space in Mont-Saint-Guibert, Waals-Brabant
 More info
Office space in Mont-Saint-Guibert, Waals-Brabant
Office space for rent in Mont-Saint-Guibert, Waals-Brabant
Areal
Ca. 290 m2
Pris pr. md.
Ca. 3,650 EUR pr md
Område
Mont-Saint-Guibert, Waals-Brabant
Type
Office space
Office space in Ottignies-Louvain-la-Neuve, Waals-Brabant
 More info
Office space in Ottignies-Louvain-la-Neuve, Waals-Brabant
Office space for rent in Ottignies-Louvain-la-Neuve, Waals-Brabant
Areal
Ca. 920 m2
Pris pr. md.
Ca. 11,500 EUR pr md
Område
Ottignies-Louvain-la-Neuve, Waals-Brabant
Type
Office space
Office space in Waterloo, Waals-Brabant
 More info
Office space in Waterloo, Waals-Brabant
Office space for rent in Waterloo, Waals-Brabant
Areal
Ca. 25 m2
Pris pr. md.
Ca. 700 EUR pr md
Område
Waterloo, Waals-Brabant
Type
Office space
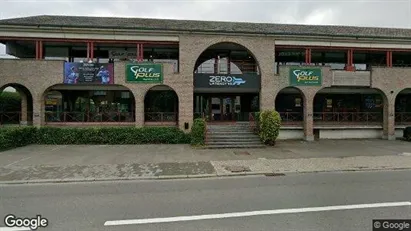
Commercial space in Waterloo, Waals-Brabant
 More info
Commercial space in Waterloo, Waals-Brabant
Commercial space for rent in Waterloo, Waals-Brabant
Areal
-
Pris pr. md.
Ca. 6,900 EUR pr md
Område
Waterloo, Waals-Brabant
Type
Commercial property
Office space in Waver, Waals-Brabant
 More info
Office space in Waver, Waals-Brabant
Office space for rent in Waver, Waals-Brabant
Areal
Ca. 235 m2
Pris pr. md.
Ca. 7,250 EUR pr md
Område
Waver, Waals-Brabant
Type
Office space
Office space in Waver, Waals-Brabant
 More info
Office space in Waver, Waals-Brabant
Office space for rent in Waver, Waals-Brabant
Areal
Ca. 780 m2
Pris pr. md.
Ca. 8,500 EUR pr md
Område
Waver, Waals-Brabant
Type
Office space
Office space in Mont-Saint-Guibert, Waals-Brabant
 More info
Office space in Mont-Saint-Guibert, Waals-Brabant
Office space for rent in Mont-Saint-Guibert, Waals-Brabant
Areal
Ca. 595 m2
Pris pr. md.
Ca. 8,200 EUR pr md
Område
Mont-Saint-Guibert, Waals-Brabant
Type
Office space
Office space in Ottignies-Louvain-la-Neuve, Waals-Brabant
 More info
Office space in Ottignies-Louvain-la-Neuve, Waals-Brabant
Office space for rent in Ottignies-Louvain-la-Neuve, Waals-Brabant
Areal
Ca. 15 m2
Pris pr. md.
Ca. 750 EUR pr md
Område
Ottignies-Louvain-la-Neuve, Waals-Brabant
Type
Office space
Office space in Ottignies-Louvain-la-Neuve, Waals-Brabant
 More info
Office space in Ottignies-Louvain-la-Neuve, Waals-Brabant
Office space for rent in Ottignies-Louvain-la-Neuve, Waals-Brabant
Areal
Ca. 290 m2
Pris pr. md.
Ca. 3,250 EUR pr md
Område
Ottignies-Louvain-la-Neuve, Waals-Brabant
Type
Office space
Office space in Ottignies-Louvain-la-Neuve, Waals-Brabant
 More info
Office space in Ottignies-Louvain-la-Neuve, Waals-Brabant
Office space for rent in Ottignies-Louvain-la-Neuve, Waals-Brabant
Areal
Ca. 140 m2
Pris pr. md.
Ca. 1,750 EUR pr md
Område
Ottignies-Louvain-la-Neuve, Waals-Brabant
Type
Office space
Selected customers
30,000 customers use Companyspace.com
30,000 customers
285,000 companies in our database
2,400 rentals annually
Companyspace.com is used by thousands of landlords, property companies, commercial real estate agents, investors and business centres seeking greater visibility, more enquiries and lower vacancy rates.


