


Warehouses in Belgium
Companyspace.com today:
New today 802
Updated 24h 1,026
Notifications about new companyspaces1,524
Copenhagen +2
Stockholm +1
Amsterdam +5
Berlin +7
Brussels +2
Vienna +28
Paris +3
Dublin (county) +7
Warsaw +16
Roma (region) +3
Lisbon +1
Latest update 26 min ago
Active ads 365,511
1,815 warehouses found
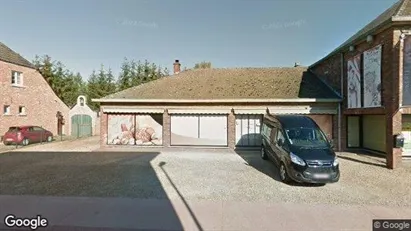
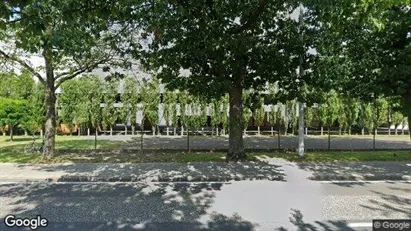
Warehouse property in Roeselare, West-Vlaanderen
 More info
Warehouse property in Roeselare, West-Vlaanderen
Warehouse for sale in Roeselare, West-Vlaanderen
Areal
Ca. 230 m2
Pris
Ca. 950,000EUR
Område
Roeselare, West-Vlaanderen
Type
Warehouse
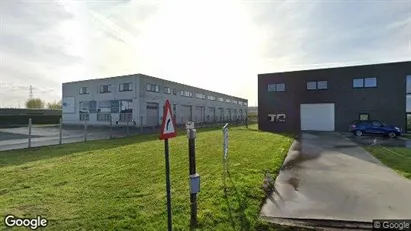
Warehouse property in Scherpenheuvel-Zichem, Vlaams-Brabant
 More info
Warehouse property in Scherpenheuvel-Zichem, Vlaams-Brabant
Warehouse for sale in Scherpenheuvel-Zichem, Vlaams-Brabant
Areal
Ca. 195 m2
Pris
Ca. 299,000EUR
Område
Scherpenheuvel-Zichem, Vlaams-Brabant
Type
Warehouse
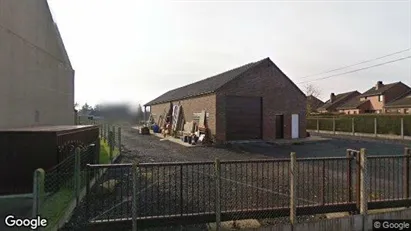
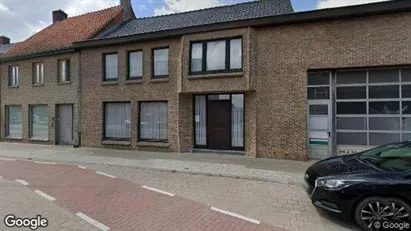
Warehouse in Vleteren, West-Vlaanderen
 More info
Warehouse in Vleteren, West-Vlaanderen
Warehouse for rent in Vleteren, West-Vlaanderen
Areal
Ca. 75 m2
Pris pr. md.
Ca. 800 EUR pr md
Område
Vleteren, West-Vlaanderen
Type
Warehouse
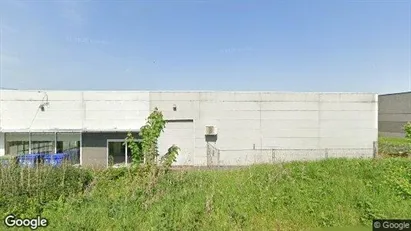
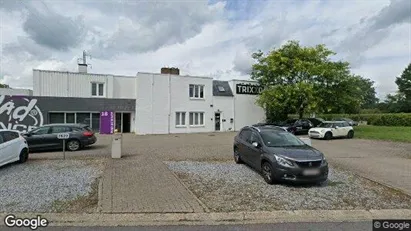
Warehouse in Lokeren, Oost-Vlaanderen
 More info
Warehouse in Lokeren, Oost-Vlaanderen
Warehouse for rent in Lokeren, Oost-Vlaanderen
Areal
Ca. 2,325 m2
Pris pr. md.
Ca. 11,900 EUR pr md
Område
Lokeren, Oost-Vlaanderen
Type
Warehouse
Warehouse property in Ronse, Oost-Vlaanderen
 More info
Warehouse property in Ronse, Oost-Vlaanderen
Warehouse for sale in Ronse, Oost-Vlaanderen
Areal
Ca. 145 m2
Pris
Ca. 365,000EUR
Område
Ronse, Oost-Vlaanderen
Type
Warehouse
Warehouse property in Deinze, Oost-Vlaanderen
 More info
Warehouse property in Deinze, Oost-Vlaanderen
Warehouse for sale in Deinze, Oost-Vlaanderen
Areal
Ca. 885 m2
Pris
Ca. 1,450,000EUR
Område
Deinze, Oost-Vlaanderen
Type
Warehouse
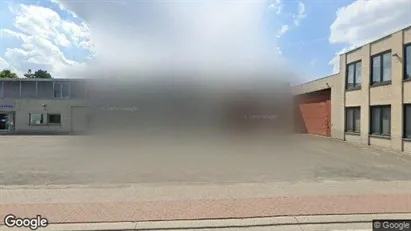
Warehouse property in Kortrijk, West-Vlaanderen
 More info
Warehouse property in Kortrijk, West-Vlaanderen
Warehouse for sale in Kortrijk, West-Vlaanderen
Areal
Ca. 3,215 m2
Pris
Ca. 1,690,000EUR
Område
Kortrijk, West-Vlaanderen
Type
Warehouse
Warehouse in Waregem, West-Vlaanderen
 More info
Warehouse in Waregem, West-Vlaanderen
Warehouse for rent in Waregem, West-Vlaanderen
Areal
Ca. 2,015 m2
Pris pr. md.
Ca. 5,050 EUR pr md
Område
Waregem, West-Vlaanderen
Type
Warehouse
Garage in Aalst, Oost-Vlaanderen
 More info
Garage in Aalst, Oost-Vlaanderen
Garage for sale in Aalst, Oost-Vlaanderen
Areal
Ca. 735 m2
Pris
Ca. 1,150,000EUR
Område
Aalst, Oost-Vlaanderen
Type
Garage
Warehouse property in Ellezelles, Henegouwen
 More info
Warehouse property in Ellezelles, Henegouwen
Warehouse for sale in Ellezelles, Henegouwen
Areal
Ca. 250 m2
Pris
Ca. 399,000EUR
Område
Ellezelles, Henegouwen
Type
Warehouse
Warehouse property in Sint-Katelijne-Waver, Antwerp (Province)
 More info
Warehouse property in Sint-Katelijne-Waver, Antwerp (Province)
Warehouse for sale in Sint-Katelijne-Waver, Antwerp (Province)
Areal
Ca. 235 m2
Pris
Ca. 421,000EUR
Område
Sint-Katelijne-Waver, Antwerp (Province)
Type
Warehouse
Warehouse property in Merelbeke, Oost-Vlaanderen
 More info
Warehouse property in Merelbeke, Oost-Vlaanderen
Warehouse for sale in Merelbeke, Oost-Vlaanderen
Areal
Ca. 2,010 m2
Pris
Ca. 739,000EUR
Område
Merelbeke, Oost-Vlaanderen
Type
Warehouse
Warehouse in Evergem, Oost-Vlaanderen
 More info
Warehouse in Evergem, Oost-Vlaanderen
Warehouse for rent in Evergem, Oost-Vlaanderen
Areal
Ca. 145 m2
Pris pr. md.
Ca. 950 EUR pr md
Område
Evergem, Oost-Vlaanderen
Type
Warehouse
Warehouse property in Vloesberg, Henegouwen
 More info
Warehouse property in Vloesberg, Henegouwen
Warehouse for sale in Vloesberg, Henegouwen
Areal
Ca. 250 m2
Pris
Ca. 399,000EUR
Område
Vloesberg, Henegouwen
Type
Warehouse
Warehouse in Vleteren, West-Vlaanderen
 More info
Warehouse in Vleteren, West-Vlaanderen
Warehouse for rent in Vleteren, West-Vlaanderen
Areal
Ca. 75 m2
Pris pr. md.
Ca. 750 EUR pr md
Område
Vleteren, West-Vlaanderen
Type
Warehouse
Showroom in Beringen, Limburg
 More info
Showroom in Beringen, Limburg
Showroom for rent in Beringen, Limburg
Areal
Ca. 830 m2
Pris pr. md.
Ca. 3,500 EUR pr md
Område
Beringen, Limburg
Type
Showroom
Showroom in Beringen, Limburg
 More info
Showroom in Beringen, Limburg
Showroom for rent in Beringen, Limburg
Areal
Ca. 830 m2
Pris pr. md.
Ca. 3,500 EUR pr md
Område
Beringen, Limburg
Type
Showroom
Warehouse in Gavere, Oost-Vlaanderen
 More info
Warehouse in Gavere, Oost-Vlaanderen
Warehouse for rent in Gavere, Oost-Vlaanderen
Areal
Ca. 1,875 m2
Pris pr. md.
Ca. 8,350 EUR pr md
Område
Gavere, Oost-Vlaanderen
Type
Warehouse
Selected customers
30,000 customers use Companyspace.com
30,000 customers
285,000 companies in our database
2,400 rentals annually
Companyspace.com is used by thousands of landlords, property companies, commercial real estate agents, investors and business centres seeking greater visibility, more enquiries and lower vacancy rates.


