Available warehouses in Belgium
See all available warehouses in Belgium below. If you are looking for warehouse in Belgium, you have come to the right place. We have most available warehouses in Belgium in our database. Find warehouse in Belgium here. Enjoy.
1,276 warehouses found
-
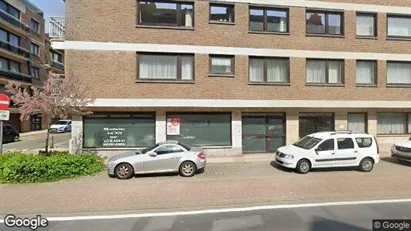
5222 m2 office space for rent in Sint-Niklaas, Oost-Vlaanderen
- 20,888 EUR per month
- 48 EUR /m2/year
-
2500 m2 warehouse for rent in Roeselare, West-Vlaanderen
- 8,333 EUR per month
- 40 EUR /m2/year
Frequently asked questions
Statistics on the development of available warehouses for rent in Belgium over the past month
Also see aggregate statistics on all available warehouses in Belgium over time, aggregate statistics on new warehouses in Belgium over time, aggregate statistics on rented warehouses in Belgium over time
| Date | |||
|---|---|---|---|
| 6. January 2026 | 1285 | 112 | 10 |
| 5. January 2026 | 1183 | 10 | 0 |
| 4. January 2026 | 1173 | 2 | 8 |
| 3. January 2026 | 1179 | 2 | 0 |
| 2. January 2026 | 1177 | 3 | 6 |
| 1. January 2026 | 1180 | 2 | 0 |
| 31. December 2025 | 1178 | 3 | 7 |
| 30. December 2025 | 1182 | 20 | 26 |
| 29. December 2025 | 1188 | 21 | 0 |
| 28. December 2025 | 1167 | 2 | 2 |
| 27. December 2025 | 1167 | 0 | 13 |
| 26. December 2025 | 1180 | 10 | 10 |
| 25. December 2025 | 1180 | 3 | 0 |
| 24. December 2025 | 1177 | 16 | 321 |
| 23. December 2025 | 1482 | 11 | 0 |
| 22. December 2025 | 1471 | 1 | 66 |
| 21. December 2025 | 1536 | 20 | 0 |
| 20. December 2025 | 1516 | 6 | 31 |
| 19. December 2025 | 1541 | 6 | 5 |
| 18. December 2025 | 1540 | 7 | 8 |
| 17. December 2025 | 1541 | 31 | 26 |
| 16. December 2025 | 1536 | 22 | 0 |
| 15. December 2025 | 1514 | 0 | 5 |
| 14. December 2025 | 1519 | 2 | 4 |
| 13. December 2025 | 1521 | 7 | 6 |
| 12. December 2025 | 1520 | 24 | 0 |
| 11. December 2025 | 1496 | 27 | 47 |
| 10. December 2025 | 1516 | 15 | 0 |
| 9. December 2025 | 1501 | 20 | 0 |
| 8. December 2025 | 1481 | 11 | 3 |
| 7. December 2025 | 1473 | 2 | 0 |
Statistics on currently available warehouses in Belgium
Also see gathered statistics of all available warehouses over time, the gathered statistics of new warehouses over time, the gathered statistics of rented warehouses over time
| Warehouses | |
|---|---|
| Available premises | 1,293 |
| New premises since yesterday | 112 |
| Rented out premises since yesterday | 10 |
| Total available m2 | 6,841,765 |
| Average price per m2 per year without expenses | 14,305 |
| Highest price per m2 per year | 798,336 |
| Lowest price per m2 per year | 1.77 |


