


Warehouses in Belgium
Companyspace.com today:
New today 143
Updated 24h 631
Notifications about new companyspaces20
Copenhagen +1
Stockholm +1
Dublin (county) +1
Warsaw +3
Latest update 36 min ago
Active ads 364,332
1,806 warehouses found
Warehouse property in Heist-op-den-Berg, Antwerp (Province)
 More info
Warehouse property in Heist-op-den-Berg, Antwerp (Province)
Warehouse for sale in Heist-op-den-Berg, Antwerp (Province)
Areal
Ca. 3,110 m2
Pris
Ca. 4,123,000EUR
Område
Heist-op-den-Berg, Antwerp (Province)
Type
Warehouse
Warehouse property in Diksmuide, West-Vlaanderen
 More info
Warehouse property in Diksmuide, West-Vlaanderen
Warehouse for sale in Diksmuide, West-Vlaanderen
Areal
Ca. 65 m2
Pris
Ca. 90,000EUR
Område
Diksmuide, West-Vlaanderen
Type
Warehouse
Warehouse property in Schoten, Antwerp (Province)
 More info
Warehouse property in Schoten, Antwerp (Province)
Warehouse for sale in Schoten, Antwerp (Province)
Areal
Ca. 1,200 m2
Pris
Ca. 2,675,000EUR
Område
Schoten, Antwerp (Province)
Type
Warehouse
Warehouse property in Heist-op-den-Berg, Antwerp (Province)
 More info
Warehouse property in Heist-op-den-Berg, Antwerp (Province)
Warehouse for sale in Heist-op-den-Berg, Antwerp (Province)
Areal
Ca. 1,630 m2
Pris
Ca. 2,284,000EUR
Område
Heist-op-den-Berg, Antwerp (Province)
Type
Warehouse
Warehouse property in Wingene, West-Vlaanderen
 More info
Warehouse property in Wingene, West-Vlaanderen
Warehouse for sale in Wingene, West-Vlaanderen
Areal
Ca. 705 m2
Pris
Ca. 235,000EUR
Område
Wingene, West-Vlaanderen
Type
Warehouse
Warehouse property in Moorslede, West-Vlaanderen
 More info
Warehouse property in Moorslede, West-Vlaanderen
Warehouse for sale in Moorslede, West-Vlaanderen
Areal
Ca. 235 m2
Pris
Ca. 399,000EUR
Område
Moorslede, West-Vlaanderen
Type
Warehouse
Warehouse property in Ledegem, West-Vlaanderen
 More info
Warehouse property in Ledegem, West-Vlaanderen
Warehouse for sale in Ledegem, West-Vlaanderen
Areal
Ca. 1,295 m2
Pris
Ca. 260,000EUR
Område
Ledegem, West-Vlaanderen
Type
Warehouse
Warehouse property in Wielsbeke, West-Vlaanderen
 More info
Warehouse property in Wielsbeke, West-Vlaanderen
Warehouse for sale in Wielsbeke, West-Vlaanderen
Areal
Ca. 270 m2
Pris
Ca. 395,000EUR
Område
Wielsbeke, West-Vlaanderen
Type
Warehouse
Warehouse property in Zottegem, Oost-Vlaanderen
 More info
Warehouse property in Zottegem, Oost-Vlaanderen
Warehouse for sale in Zottegem, Oost-Vlaanderen
Areal
Ca. 225 m2
Pris
Ca. 415,000EUR
Område
Zottegem, Oost-Vlaanderen
Type
Warehouse
Warehouse property in Aalst, Oost-Vlaanderen
 More info
Warehouse property in Aalst, Oost-Vlaanderen
Warehouse for sale in Aalst, Oost-Vlaanderen
Areal
-
Pris
Ca. 530,000EUR
Område
Aalst, Oost-Vlaanderen
Type
Warehouse
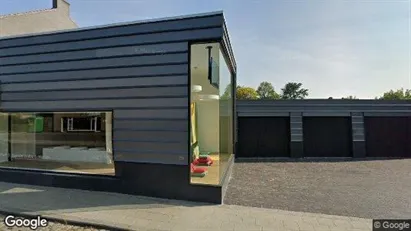
Warehouse property in Zedelgem, West-Vlaanderen
 More info
Warehouse property in Zedelgem, West-Vlaanderen
Warehouse for sale in Zedelgem, West-Vlaanderen
Areal
Ca. 335 m2
Pris
Ca. 457,000EUR
Område
Zedelgem, West-Vlaanderen
Type
Warehouse
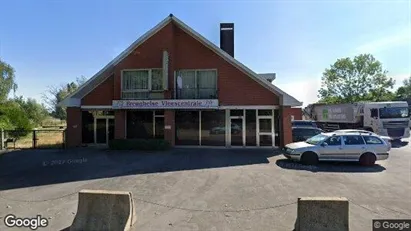
Warehouse property in Zedelgem, West-Vlaanderen
 More info
Warehouse property in Zedelgem, West-Vlaanderen
Warehouse for sale in Zedelgem, West-Vlaanderen
Areal
Ca. 330 m2
Pris
Ca. 507,000EUR
Område
Zedelgem, West-Vlaanderen
Type
Warehouse
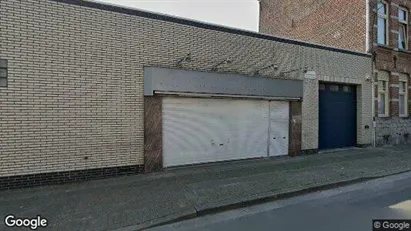
Warehouse property in Hooglede, West-Vlaanderen
 More info
Warehouse property in Hooglede, West-Vlaanderen
Warehouse for sale in Hooglede, West-Vlaanderen
Areal
-
Pris
Ca. 399,000EUR
Område
Hooglede, West-Vlaanderen
Type
Warehouse
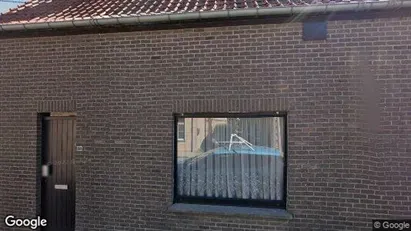
Warehouse property in Wingene, West-Vlaanderen
 More info
Warehouse property in Wingene, West-Vlaanderen
Warehouse for sale in Wingene, West-Vlaanderen
Areal
Ca. 295 m2
Pris
Ca. 433,000EUR
Område
Wingene, West-Vlaanderen
Type
Warehouse
Warehouse property in Wingene, West-Vlaanderen
 More info
Warehouse property in Wingene, West-Vlaanderen
Warehouse for sale in Wingene, West-Vlaanderen
Areal
Ca. 280 m2
Pris
Ca. 413,000EUR
Område
Wingene, West-Vlaanderen
Type
Warehouse
Warehouse property in Zedelgem, West-Vlaanderen
 More info
Warehouse property in Zedelgem, West-Vlaanderen
Warehouse for sale in Zedelgem, West-Vlaanderen
Areal
Ca. 305 m2
Pris
Ca. 419,000EUR
Område
Zedelgem, West-Vlaanderen
Type
Warehouse
Warehouse property in Ronse, Oost-Vlaanderen
 More info
Warehouse property in Ronse, Oost-Vlaanderen
Warehouse for sale in Ronse, Oost-Vlaanderen
Areal
Ca. 760 m2
Pris
Ca. 585,000EUR
Område
Ronse, Oost-Vlaanderen
Type
Warehouse
Warehouse property in Wingene, West-Vlaanderen
 More info
Warehouse property in Wingene, West-Vlaanderen
Warehouse for sale in Wingene, West-Vlaanderen
Areal
Ca. 275 m2
Pris
Ca. 406,000EUR
Område
Wingene, West-Vlaanderen
Type
Warehouse
Selected customers
Selected customers
30,000 customers use Companyspace.com
30,000 customers
285,000 companies in our database
2,400 rentals annually
Companyspace.com is used by thousands of landlords, property companies, commercial real estate agents, investors and business centres seeking greater visibility, more enquiries and lower vacancy rates.


