


Warehouses in Belgium
Companyspace.com today:
New today 30
Updated 24h 1,124
Copenhagen +5
Vienna +1
Latest update 1 min ago
Active ads 364,399
1,822 warehouses found
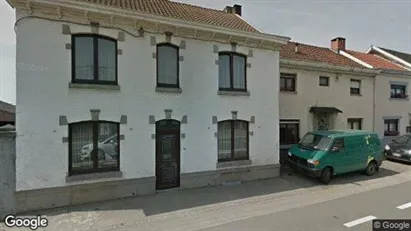
Garage in Deinze, Oost-Vlaanderen
 More info
Garage in Deinze, Oost-Vlaanderen
Garage for sale in Deinze, Oost-Vlaanderen
Areal
-
Pris
Ca. 25,000EUR
Område
Deinze, Oost-Vlaanderen
Type
Garage
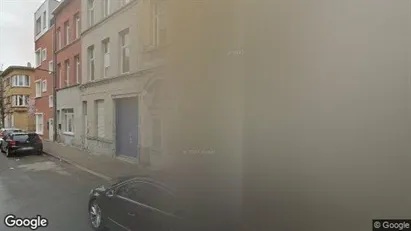
Warehouse property in Stad Antwerp, Antwerp
 More info
Warehouse property in Stad Antwerp, Antwerp
Warehouse for sale in Stad Antwerp, Antwerp
Areal
Ca. 180 m2
Pris
Ca. 199,000EUR
Område
Stad Antwerp, Antwerp
Type
Warehouse
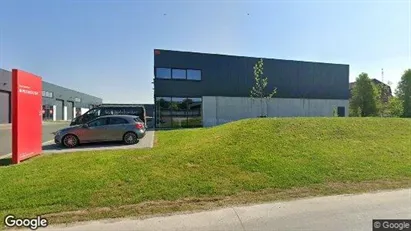
Warehouse property in Pelt, Limburg
 More info
Warehouse property in Pelt, Limburg
Warehouse for sale in Pelt, Limburg
Areal
Ca. 280 m2
Pris
Ca. 239,000EUR
Område
Pelt, Limburg
Type
Warehouse
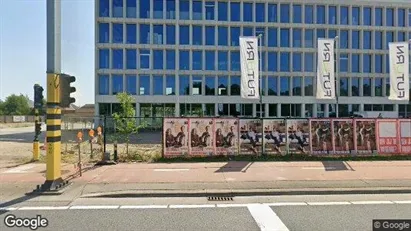
Warehouse property in Edingen, Henegouwen
 More info
Warehouse property in Edingen, Henegouwen
Warehouse for sale in Edingen, Henegouwen
Areal
Ca. 225 m2
Pris
Ca. 335,000EUR
Område
Edingen, Henegouwen
Type
Warehouse
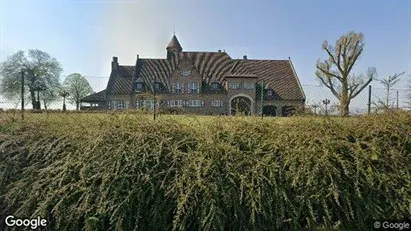
Warehouse property in Waver, Waals-Brabant
 More info
Warehouse property in Waver, Waals-Brabant
Warehouse for sale in Waver, Waals-Brabant
Areal
Ca. 1,770 m2
Pris
Ca. 2,200,000EUR
Område
Waver, Waals-Brabant
Type
Warehouse
Warehouse property in Leuven, Vlaams-Brabant
 More info
Warehouse property in Leuven, Vlaams-Brabant
Warehouse for sale in Leuven, Vlaams-Brabant
Areal
-
Pris
Ca. 265,000EUR
Område
Leuven, Vlaams-Brabant
Type
Warehouse
Warehouse property in Zwevegem, West-Vlaanderen
 More info
Warehouse property in Zwevegem, West-Vlaanderen
Warehouse for sale in Zwevegem, West-Vlaanderen
Areal
Ca. 220 m2
Pris
Ca. 299,000EUR
Område
Zwevegem, West-Vlaanderen
Type
Warehouse
Warehouse property in Hasselt, Limburg
 More info
Warehouse property in Hasselt, Limburg
Warehouse for sale in Hasselt, Limburg
Areal
Ca. 290 m2
Pris
Ca. 375,000EUR
Område
Hasselt, Limburg
Type
Warehouse
Warehouse property in Zwevegem, West-Vlaanderen
 More info
Warehouse property in Zwevegem, West-Vlaanderen
Warehouse for sale in Zwevegem, West-Vlaanderen
Areal
Ca. 285 m2
Pris
Ca. 384,000EUR
Område
Zwevegem, West-Vlaanderen
Type
Warehouse
Warehouse property in Zwevegem, West-Vlaanderen
 More info
Warehouse property in Zwevegem, West-Vlaanderen
Warehouse for sale in Zwevegem, West-Vlaanderen
Areal
Ca. 215 m2
Pris
Ca. 292,000EUR
Område
Zwevegem, West-Vlaanderen
Type
Warehouse
Warehouse property in Zwevegem, West-Vlaanderen
 More info
Warehouse property in Zwevegem, West-Vlaanderen
Warehouse for sale in Zwevegem, West-Vlaanderen
Areal
Ca. 320 m2
Pris
Ca. 402,000EUR
Område
Zwevegem, West-Vlaanderen
Type
Warehouse
Warehouse property in Moeskroen, Henegouwen
 More info
Warehouse property in Moeskroen, Henegouwen
Warehouse for sale in Moeskroen, Henegouwen
Areal
Ca. 70 m2
Pris
Ca. 85,000EUR
Område
Moeskroen, Henegouwen
Type
Warehouse
Warehouse property in Awans, Luik (region)
 More info
Warehouse property in Awans, Luik (region)
Warehouse for sale in Awans, Luik (region)
Areal
Ca. 325 m2
Pris
Ca. 405,000EUR
Område
Awans, Luik (region)
Type
Warehouse
Warehouse in Antwerp Merksem, Antwerp
 More info
Warehouse in Antwerp Merksem, Antwerp
Warehouse for rent in Antwerp Merksem, Antwerp
Areal
Ca. 2,085 m2
Pris pr. md.
Ca. 10,900 EUR per month
Område
Antwerp Merksem, Antwerp
Type
Warehouse
Warehouse property in Aalst, Oost-Vlaanderen
 More info
Warehouse property in Aalst, Oost-Vlaanderen
Warehouse for sale in Aalst, Oost-Vlaanderen
Areal
Ca. 200 m2
Pris
Ca. 349,000EUR
Område
Aalst, Oost-Vlaanderen
Type
Warehouse
Warehouse property in Ledegem, West-Vlaanderen
 More info
Warehouse property in Ledegem, West-Vlaanderen
Warehouse for sale in Ledegem, West-Vlaanderen
Areal
Ca. 235 m2
Pris
Ca. 410,000EUR
Område
Ledegem, West-Vlaanderen
Type
Warehouse
Warehouse property in Bornem, Antwerp (Province)
 More info
Warehouse property in Bornem, Antwerp (Province)
Warehouse for sale in Bornem, Antwerp (Province)
Areal
Ca. 250 m2
Pris
Ca. 419,000EUR
Område
Bornem, Antwerp (Province)
Type
Warehouse
Warehouse property in Scherpenheuvel-Zichem, Vlaams-Brabant
 More info
Warehouse property in Scherpenheuvel-Zichem, Vlaams-Brabant
Warehouse for sale in Scherpenheuvel-Zichem, Vlaams-Brabant
Areal
Ca. 195 m2
Pris
Ca. 299,000EUR
Område
Scherpenheuvel-Zichem, Vlaams-Brabant
Type
Warehouse
Selected customers
Selected customers
30,000 customers use Companyspace.com
30,000 customers
285,000 companies in our database
2,400 rentals annually
Companyspace.com is used by thousands of landlords, property companies, commercial real estate agents, investors and business centres seeking greater visibility, more enquiries and lower vacancy rates.


