


Office spacesin Gent
See all available office spaces in Gent below. If you are looking for office space in Gent, you have come to the right place. We have most available office spaces in Gent in our database. Find office space in Gent here. Enjoy.
Companyspace.com today:
New today 147
Updated 24h 1,020
Notifications about new companyspaces1
Copenhagen +6
Latest update 1 min ago
Active ads 365,603
553 office spaces found
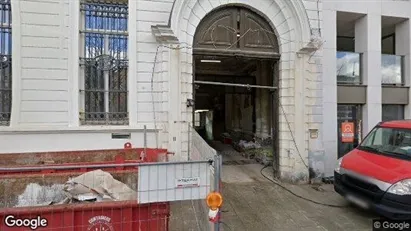
Office property in Stad Gent, Gent
 More info
Office property in Stad Gent, Gent
Office space for sale in Stad Gent, Gent
Areal
Ca. 155 m2
Pris
Ca. 350,000EUR
Område
Stad Gent, Gent
Type
Office space
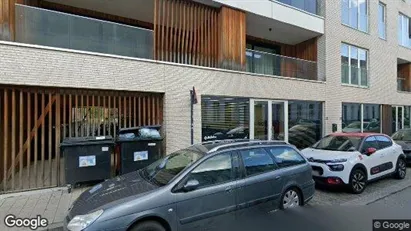
Office property in Stad Gent, Gent
 More info
Office property in Stad Gent, Gent
Office space for sale in Stad Gent, Gent
Areal
Ca. 130 m2
Pris
Ca. 356,000EUR
Område
Stad Gent, Gent
Type
Office space
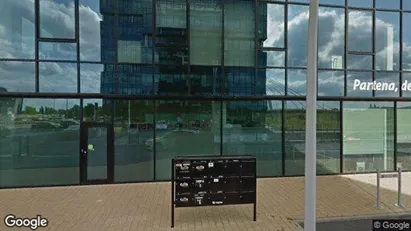
Office space in Stad Gent, Gent
 More info
Office space in Stad Gent, Gent
Office space for rent in Stad Gent, Gent
Areal
Ca. 400 m2
Pris pr. md.
Ca. 5,800 EUR pr md
Område
Stad Gent, Gent
Type
Office space
Office space in Stad Gent, Gent
 More info
Office space in Stad Gent, Gent
Office space for rent in Stad Gent, Gent
Areal
Ca. 275 m2
Pris pr. md.
Ca. 3,300 EUR pr md
Område
Stad Gent, Gent
Type
Office space
Office space in Stad Gent, Gent
 More info
Office space in Stad Gent, Gent
Office space for rent in Stad Gent, Gent
Areal
Ca. 335 m2
Pris pr. md.
Ca. 3,900 EUR pr md
Område
Stad Gent, Gent
Type
Office space
Office space in Stad Gent, Gent
 More info
Office space in Stad Gent, Gent
Office space for rent in Stad Gent, Gent
Areal
Ca. 1,790 m2
Pris pr. md.
Ca. 6,350 EUR pr md
Område
Stad Gent, Gent
Type
Office space
Office property in Gent Sint-Denijs-Westrem, Gent
 More info
Office property in Gent Sint-Denijs-Westrem, Gent
Office space for sale in Gent Sint-Denijs-Westrem, Gent
Areal
Ca. 3,845 m2
Pris
Ca. 2,166,000EUR
Område
Gent Sint-Denijs-Westrem, Gent
Type
Office space
Office space in Gent Drongen, Gent
 More info
Office space in Gent Drongen, Gent
Office space for rent in Gent Drongen, Gent
Areal
Ca. 395 m2
Pris pr. md.
Ca. 2,650 EUR pr md
Område
Gent Drongen, Gent
Type
Office space
Office space in Gent Drongen, Gent
 More info
Office space in Gent Drongen, Gent
Office space for rent in Gent Drongen, Gent
Areal
Ca. 105 m2
Pris pr. md.
Ca. 700 EUR pr md
Område
Gent Drongen, Gent
Type
Office space
Office space in Stad Gent, Gent
 More info
Office space in Stad Gent, Gent
Office space for rent in Stad Gent, Gent
Areal
Ca. 180 m2
Pris pr. md.
Ca. 2,400 EUR pr md
Område
Stad Gent, Gent
Type
Office space
Office space in Gent Sint-Denijs-Westrem, Gent
 More info
Office space in Gent Sint-Denijs-Westrem, Gent
Office space for rent in Gent Sint-Denijs-Westrem, Gent
Areal
-
Pris pr. md.
Ca. 50 EUR pr md
Område
Gent Sint-Denijs-Westrem, Gent
Type
Office space
Office property in Gent Sint-Amandsberg, Gent
 More info
Office property in Gent Sint-Amandsberg, Gent
Office space for sale in Gent Sint-Amandsberg, Gent
Areal
Ca. 330 m2
Pris
Ca. 750,000EUR
Område
Gent Sint-Amandsberg, Gent
Type
Office space
Office space in Stad Gent, Gent
 More info
Office space in Stad Gent, Gent
Office space for rent in Stad Gent, Gent
Areal
Ca. 815 m2
Pris pr. md.
Ca. 10,850 EUR pr md
Område
Stad Gent, Gent
Type
Office space
Office space in Gent Zwijnaarde, Gent
 More info
Office space in Gent Zwijnaarde, Gent
Office space for rent in Gent Zwijnaarde, Gent
Areal
-
Pris pr. md.
Ca. 11,100 EUR pr md
Område
Gent Zwijnaarde, Gent
Type
Office space
Office space in Stad Gent, Gent
 More info
Office space in Stad Gent, Gent
Office space for rent in Stad Gent, Gent
Areal
Ca. 140 m2
Pris pr. md.
Ca. 1,650 EUR pr md
Område
Stad Gent, Gent
Type
Office space
Office property in Gent Sint-Denijs-Westrem, Gent
 More info
Office property in Gent Sint-Denijs-Westrem, Gent
Office space for sale in Gent Sint-Denijs-Westrem, Gent
Areal
Ca. 840 m2
Pris
Ca. 3,415,000EUR
Område
Gent Sint-Denijs-Westrem, Gent
Type
Office space
Office space in Stad Gent, Gent
 More info
Office space in Stad Gent, Gent
Office space for rent in Stad Gent, Gent
Areal
Ca. 440 m2
Pris pr. md.
Ca. 6,000 EUR pr md
Område
Stad Gent, Gent
Type
Office space
Office space in Gent Zwijnaarde, Gent
 More info
Office space in Gent Zwijnaarde, Gent
Office space for rent in Gent Zwijnaarde, Gent
Areal
Ca. 1,790 m2
Pris pr. md.
Ca. 3,150 EUR pr md
Område
Gent Zwijnaarde, Gent
Type
Office space
Selected customers
30,000 customers use Companyspace.com
30,000 customers
285,000 companies in our database
2,400 rentals annually
Companyspace.com is used by thousands of landlords, property companies, commercial real estate agents, investors and business centres seeking greater visibility, more enquiries and lower vacancy rates.


