


Office spacesin Gent
See all available office spaces in Gent below. If you are looking for office space in Gent, you have come to the right place. We have most available office spaces in Gent in our database. Find office space in Gent here. Enjoy.
Companyspace.com today:
New today 806
Updated 24h 1,319
Notifications about new companyspaces1,954
Copenhagen +4
Amsterdam +1
Berlin +4
Brussels +7
Vienna +26
Madrid +1
Dublin (county) +19
Warsaw +52
Roma (region) +1
Latest update 3 min ago
Active ads 364,396
555 office spaces found
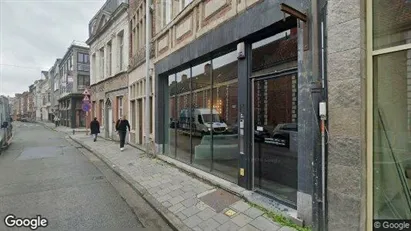
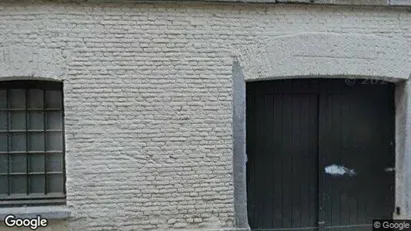
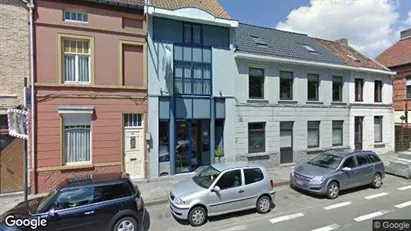
Office property in Stad Gent, Gent
 More info
Office property in Stad Gent, Gent
Office space for sale in Stad Gent, Gent
Areal
Ca. 325 m2
Pris
Ca. 1,200,000EUR
Område
Stad Gent, Gent
Type
Office space
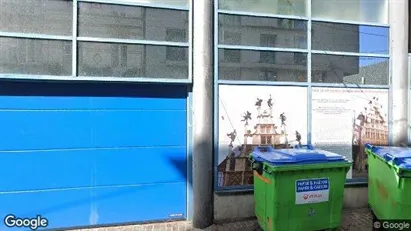
Office property in Stad Gent, Gent
 More info
Office property in Stad Gent, Gent
Office space for sale in Stad Gent, Gent
Areal
Ca. 325 m2
Pris
Ca. 1,200,000EUR
Område
Stad Gent, Gent
Type
Office space
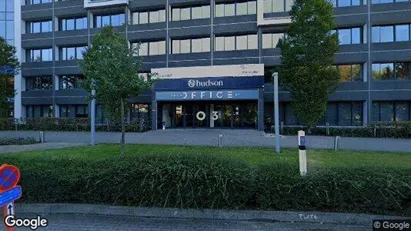
Office space in Stad Gent, Gent
 More info
Office space in Stad Gent, Gent
Office space for rent in Stad Gent, Gent
Areal
-
Pris pr. md.
Ca. 4,750 EUR per month
Område
Stad Gent, Gent
Type
Office space
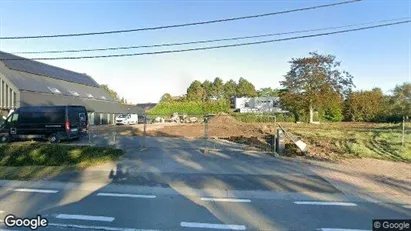
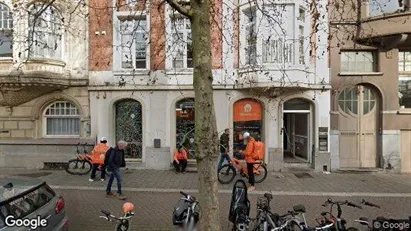
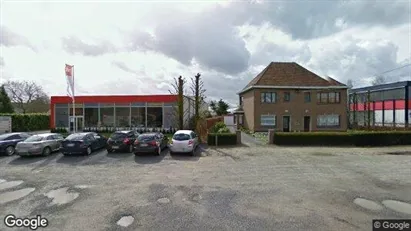
Office property in Gent Oostakker, Gent
 More info
Office property in Gent Oostakker, Gent
Office space for sale in Gent Oostakker, Gent
Areal
Ca. 390 m2
Pris
Ca. 1,180,000EUR
Område
Gent Oostakker, Gent
Type
Office space
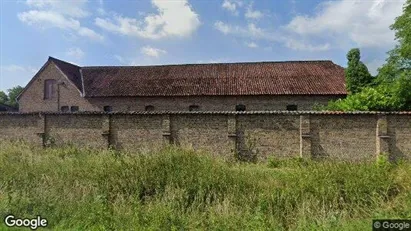
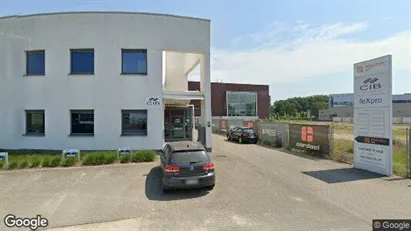
Office space in Gent Zwijnaarde, Gent
 More info
Office space in Gent Zwijnaarde, Gent
Office space for rent in Gent Zwijnaarde, Gent
Areal
Ca. 215 m2
Pris pr. md.
Ca. 3,300 EUR per month
Område
Gent Zwijnaarde, Gent
Type
Office space
Office property in Stad Gent, Gent
 More info
Office property in Stad Gent, Gent
Office space for sale in Stad Gent, Gent
Areal
Ca. 300 m2
Pris
Ca. 945,000EUR
Område
Stad Gent, Gent
Type
Office space
Office property in Gent Drongen, Gent
 More info
Office property in Gent Drongen, Gent
Office space for sale in Gent Drongen, Gent
Areal
Ca. 140 m2
Pris
Ca. 379,000EUR
Område
Gent Drongen, Gent
Type
Office space
Office space in Stad Gent, Gent
 More info
Office space in Stad Gent, Gent
Office space for rent in Stad Gent, Gent
Areal
Ca. 1,190 m2
Pris pr. md.
Ca. 13,550 EUR per month
Område
Stad Gent, Gent
Type
Office space
Office space in Stad Gent, Gent
 More info
Office space in Stad Gent, Gent
Office space for rent in Stad Gent, Gent
Areal
Ca. 445 m2
Pris pr. md.
Ca. 4,750 EUR per month
Område
Stad Gent, Gent
Type
Office space
Office property in Stad Gent, Gent
 More info
Office property in Stad Gent, Gent
Office space for sale in Stad Gent, Gent
Areal
Ca. 950 m2
Pris
Ca. 3,420,000EUR
Område
Stad Gent, Gent
Type
Office space
Office space in Stad Gent, Gent
 More info
Office space in Stad Gent, Gent
Office space for rent in Stad Gent, Gent
Areal
Ca. 440 m2
Pris pr. md.
Ca. 4,800 EUR per month
Område
Stad Gent, Gent
Type
Office space
Office property in Stad Gent, Gent
 More info
Office property in Stad Gent, Gent
Office space for sale in Stad Gent, Gent
Areal
Ca. 610 m2
Pris
Ca. 2,203,000EUR
Område
Stad Gent, Gent
Type
Office space
Office property in Gent Zwijnaarde, Gent
 More info
Office property in Gent Zwijnaarde, Gent
Office space for sale in Gent Zwijnaarde, Gent
Areal
Ca. 2,315 m2
Pris
Ca. 2,750,000EUR
Område
Gent Zwijnaarde, Gent
Type
Office space
Office property in Gent Sint-Amandsberg, Gent
 More info
Office property in Gent Sint-Amandsberg, Gent
Office space for sale in Gent Sint-Amandsberg, Gent
Areal
Ca. 125 m2
Pris
Ca. 398,000EUR
Område
Gent Sint-Amandsberg, Gent
Type
Office space
Office property in Gent Oostakker, Gent
 More info
Office property in Gent Oostakker, Gent
Office space for sale in Gent Oostakker, Gent
Areal
Ca. 165 m2
Pris
Ca. 175,000EUR
Område
Gent Oostakker, Gent
Type
Office space
Office space in Gent Sint-Denijs-Westrem, Gent
 More info
Office space in Gent Sint-Denijs-Westrem, Gent
Office space for rent in Gent Sint-Denijs-Westrem, Gent
Areal
Ca. 675 m2
Pris pr. md.
Ca. 8,400 EUR per month
Område
Gent Sint-Denijs-Westrem, Gent
Type
Office space
Office space in Stad Gent, Gent
 More info
Office space in Stad Gent, Gent
Office space for rent in Stad Gent, Gent
Areal
-
Pris pr. md.
Ca. 6,350 EUR per month
Område
Stad Gent, Gent
Type
Office space
Office space in Gent Drongen, Gent
 More info
Office space in Gent Drongen, Gent
Office space for rent in Gent Drongen, Gent
Areal
Ca. 620 m2
Pris pr. md.
Ca. 3,250 EUR per month
Område
Gent Drongen, Gent
Type
Office space
Selected customers
Selected customers
30,000 customers use Companyspace.com
30,000 customers
285,000 companies in our database
2,400 rentals annually
Companyspace.com is used by thousands of landlords, property companies, commercial real estate agents, investors and business centres seeking greater visibility, more enquiries and lower vacancy rates.


