


Office spacesin Gent
See all available office spaces in Gent below. If you are looking for office space in Gent, you have come to the right place. We have most available office spaces in Gent in our database. Find office space in Gent here. Enjoy.
Companyspace.com today:
Updated 24h 178
Latest update 1 h ago
Active ads 371,560
563 office spaces found
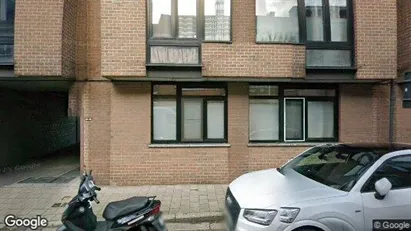
Office space in Stad Gent, Gent
 More info
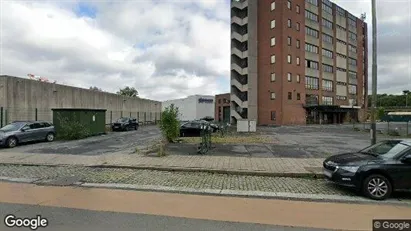
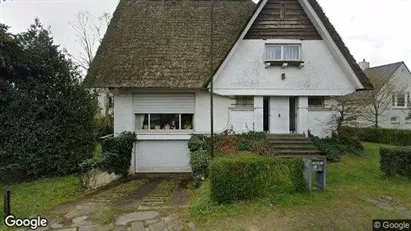
Office space in Stad Gent, Gent
Office space for rent in Stad Gent, Gent
Areal
Ca. 235 m2
Pris pr. md.
Ca. 2,950 EUR pr md
Område
Stad Gent, Gent
Type
Office space
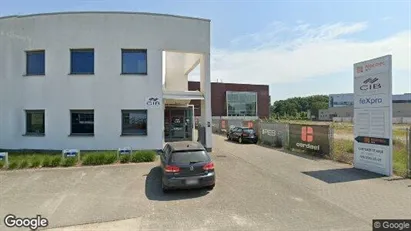
Office property in Stad Gent, Gent
 More info
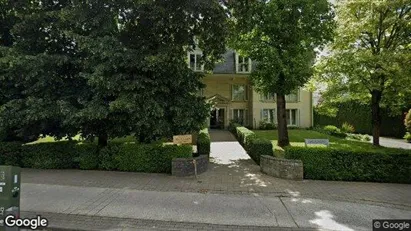
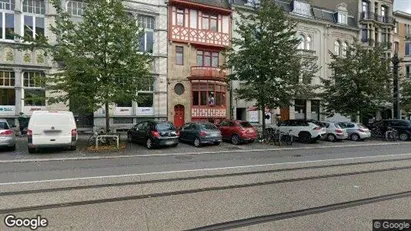
Office property in Stad Gent, Gent
Office space for sale in Stad Gent, Gent
Areal
Ca. 130 m2
Pris
Ca. 375,000EUR
Område
Stad Gent, Gent
Type
Office space
Office space in Stad Gent, Gent
 More info
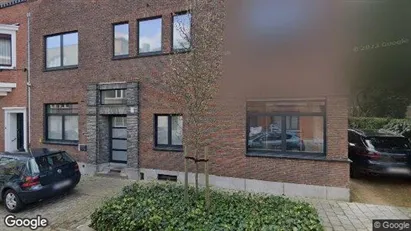
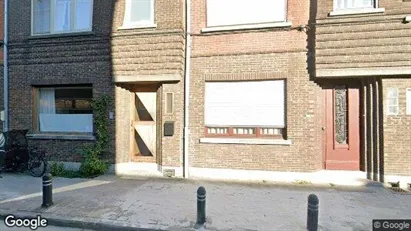
Office space in Stad Gent, Gent
Office space for rent in Stad Gent, Gent
Areal
Ca. 15 m2
Pris pr. md.
Ca. 650 EUR pr md
Område
Stad Gent, Gent
Type
Office space
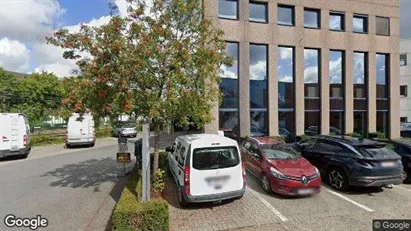
Office property in Stad Gent, Gent
 More info
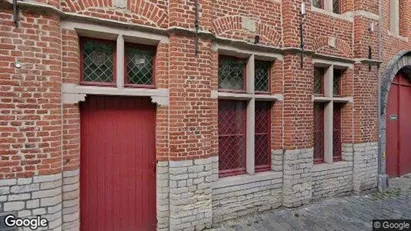
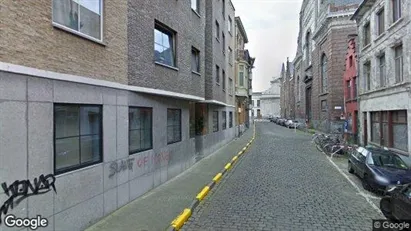
Office property in Stad Gent, Gent
Office space for sale in Stad Gent, Gent
Areal
Ca. 1,285 m2
Pris
Ca. 2,200,000EUR
Område
Stad Gent, Gent
Type
Office space
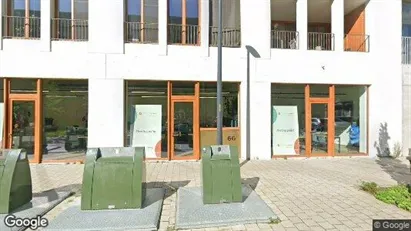
Office property in Stad Gent, Gent
 More info
Office property in Stad Gent, Gent
Office space for sale in Stad Gent, Gent
Areal
Ca. 415 m2
Pris
Ca. 595,000EUR
Område
Stad Gent, Gent
Type
Office space
Office property in Gent Sint-Amandsberg, Gent
 More info
Office property in Gent Sint-Amandsberg, Gent
Office space for sale in Gent Sint-Amandsberg, Gent
Areal
Ca. 95 m2
Pris
Ca. 267,000EUR
Område
Gent Sint-Amandsberg, Gent
Type
Office space
Office property in Stad Gent, Gent
 More info
Office property in Stad Gent, Gent
Office space for sale in Stad Gent, Gent
Areal
Ca. 415 m2
Pris
Ca. 595,000EUR
Område
Stad Gent, Gent
Type
Office space
Office property in Gent Zwijnaarde, Gent
 More info
Office property in Gent Zwijnaarde, Gent
Office space for sale in Gent Zwijnaarde, Gent
Areal
Ca. 1,320 m2
Pris
Ca. 1,249,000EUR
Område
Gent Zwijnaarde, Gent
Type
Office space
Office space in Gent Sint-Denijs-Westrem, Gent
 More info
Office space in Gent Sint-Denijs-Westrem, Gent
Office space for rent in Gent Sint-Denijs-Westrem, Gent
Areal
Ca. 255 m2
Pris pr. md.
Ca. 2,850 EUR pr md
Område
Gent Sint-Denijs-Westrem, Gent
Type
Office space
Office property in Gent Zwijnaarde, Gent
 More info
Office property in Gent Zwijnaarde, Gent
Office space for sale in Gent Zwijnaarde, Gent
Areal
Ca. 1,330 m2
Pris
Ca. 2,995,000EUR
Område
Gent Zwijnaarde, Gent
Type
Office space
Office property in Stad Gent, Gent
 More info
Office property in Stad Gent, Gent
Office space for sale in Stad Gent, Gent
Areal
Ca. 25 m2
Pris
Ca. 95,000EUR
Område
Stad Gent, Gent
Type
Office space
Office property in Gent Sint-Denijs-Westrem, Gent
 More info
Office property in Gent Sint-Denijs-Westrem, Gent
Office space for sale in Gent Sint-Denijs-Westrem, Gent
Areal
Ca. 195 m2
Pris
Ca. 495,000EUR
Område
Gent Sint-Denijs-Westrem, Gent
Type
Office space
Office property in Stad Gent, Gent
 More info
Office property in Stad Gent, Gent
Office space for sale in Stad Gent, Gent
Areal
Ca. 100 m2
Pris
Ca. 275,000EUR
Område
Stad Gent, Gent
Type
Office space
Office space in Stad Gent, Gent
 More info
Office space in Stad Gent, Gent
Office space for rent in Stad Gent, Gent
Areal
Ca. 30 m2
Pris pr. md.
Ca. 700 EUR pr md
Område
Stad Gent, Gent
Type
Office space
Office property in Stad Gent, Gent
 More info
Office property in Stad Gent, Gent
Office space for sale in Stad Gent, Gent
Areal
Ca. 95 m2
Pris
Ca. 325,000EUR
Område
Stad Gent, Gent
Type
Office space
Office property in Stad Gent, Gent
 More info
Office property in Stad Gent, Gent
Office space for sale in Stad Gent, Gent
Areal
Ca. 210 m2
Pris
Ca. 460,000EUR
Område
Stad Gent, Gent
Type
Office space
Office property in Stad Gent, Gent
 More info
Office property in Stad Gent, Gent
Office space for sale in Stad Gent, Gent
Areal
Ca. 70 m2
Pris
Ca. 235,000EUR
Område
Stad Gent, Gent
Type
Office space
Office property in Gent Wondelgem, Gent
 More info
Office property in Gent Wondelgem, Gent
Office space for sale in Gent Wondelgem, Gent
Areal
Ca. 120 m2
Pris
Ca. 349,000EUR
Område
Gent Wondelgem, Gent
Type
Office space
Selected customers
30,000 customers use Companyspace.com
30,000 customers
285,000 companies in our database
2,400 rentals annually
Companyspace.com is used by thousands of landlords, property companies, commercial real estate agents, investors and business centres seeking greater visibility, more enquiries and lower vacancy rates.


