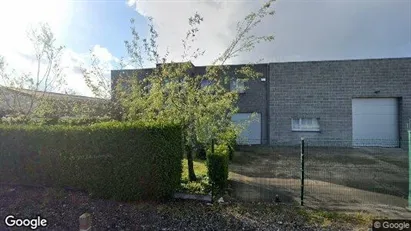
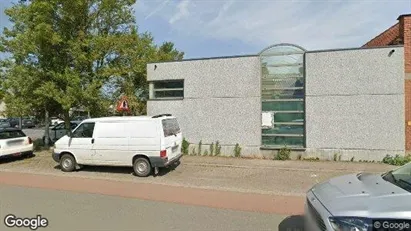
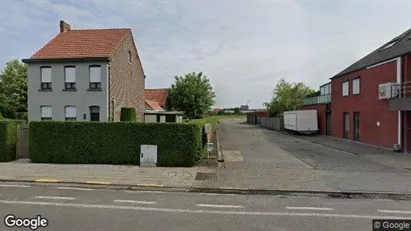
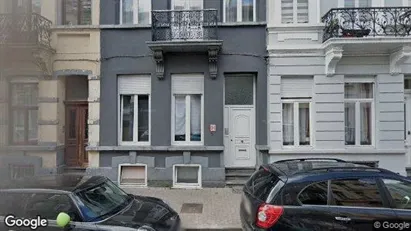
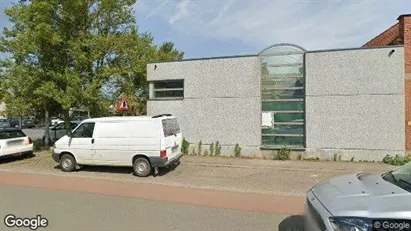
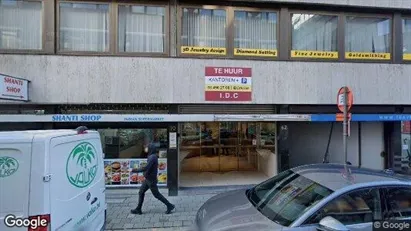
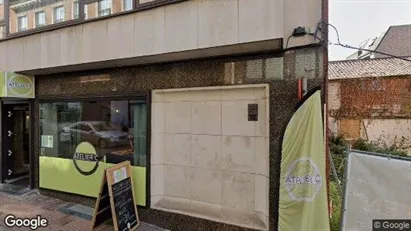
Available commercial properties in Belgium
See all available commercial properties in Belgium below. If you are looking for commercial property in Belgium, you have come to the right place. We have most available commercial properties in Belgium in our database. Find commercial property in Belgium here. Enjoy.
5,547 commercial properties found
Frequently asked questions
Statistics on the development of available commercial properties for rent in Belgium over the past month
Also see aggregate statistics on all available commercial properties in Belgium over time, aggregate statistics on new commercial properties in Belgium over time, aggregate statistics on rented commercial properties in Belgium over time
| Date | |||
|---|---|---|---|
| 5. February 2026 | 5379 | 100 | 96 |
| 4. February 2026 | 5375 | 163 | 567 |
| 3. February 2026 | 5779 | 74 | 77 |
| 2. February 2026 | 5782 | 354 | 429 |
| 1. February 2026 | 5857 | 272 | 0 |
| 31. January 2026 | 5585 | 352 | 287 |
| 30. January 2026 | 5520 | 217 | 336 |
| 29. January 2026 | 5639 | 98 | 64 |
| 28. January 2026 | 5605 | 17 | 283 |
| 27. January 2026 | 5871 | 248 | 235 |
| 26. January 2026 | 5858 | 116 | 22 |
| 25. January 2026 | 5764 | 333 | 251 |
| 24. January 2026 | 5682 | 244 | 0 |
| 23. January 2026 | 5438 | 56 | 156 |
| 22. January 2026 | 5538 | 165 | 491 |
| 21. January 2026 | 5864 | 4 | 24 |
| 20. January 2026 | 5884 | 256 | 140 |
| 19. January 2026 | 5768 | 236 | 340 |
| 18. January 2026 | 5872 | 210 | 0 |
| 17. January 2026 | 5662 | 176 | 301 |
| 16. January 2026 | 5787 | 420 | 140 |
| 15. January 2026 | 5507 | 38 | 6 |
| 14. January 2026 | 5475 | 272 | 186 |
| 13. January 2026 | 5389 | 92 | 298 |
| 12. January 2026 | 5595 | 28 | 209 |
| 11. January 2026 | 5776 | 507 | 219 |
| 10. January 2026 | 5488 | 117 | 59 |
| 9. January 2026 | 5430 | 226 | 299 |
| 8. January 2026 | 5503 | 263 | 113 |
| 7. January 2026 | 5353 | 288 | 255 |
| 6. January 2026 | 5320 | 870 | 0 |
Statistics on currently available commercial properties in Belgium
Also see gathered statistics of all available commercial properties over time, the gathered statistics of new commercial properties over time, the gathered statistics of rented commercial properties over time
| Commercial properties | |
|---|---|
| Available premises | 5,529 |
| New premises since yesterday | 100 |
| Rented out premises since yesterday | 96 |
| Total available m2 | 5,324,464 |
| Average price per m2 per year without expenses | 625 |
| Highest price per m2 per year | 49,560 |
| Lowest price per m2 per year | 1.1 |


