


Commercial properties in Belgium
Companyspace.com today:
New today 6
Updated 24h 1,783
Latest update 2 min ago
Active ads 366,318
8,333 commercial properties found
Commercial property in Bergen, Henegouwen
 More info
Commercial property in Bergen, Henegouwen
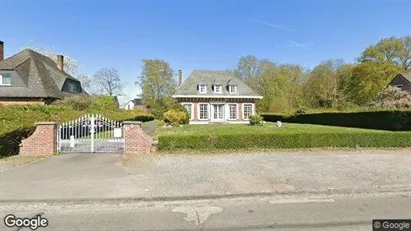
Commercial property for sale in Bergen, Henegouwen
Areal
Ca. 650 m2
Pris
Ca. 1,850,000EUR
Område
Bergen, Henegouwen
Type
Commercial property
Commercial property in Eigenbrakel, Waals-Brabant
 More info
Commercial property in Eigenbrakel, Waals-Brabant
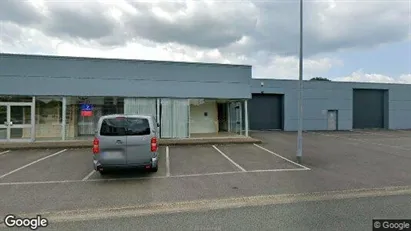
Commercial property for sale in Eigenbrakel, Waals-Brabant
Areal
Ca. 1,450 m2
Pris
Ca. 2,615,000EUR
Område
Eigenbrakel, Waals-Brabant
Type
Commercial property
Commercial property in Zedelgem, West-Vlaanderen
 More info
Commercial property in Zedelgem, West-Vlaanderen
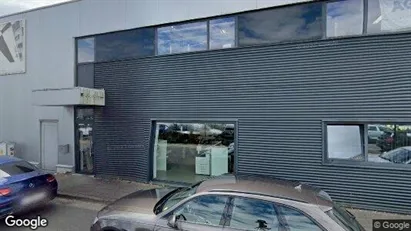
Commercial property for sale in Zedelgem, West-Vlaanderen
Areal
Ca. 1,200 m2
Pris
Ca. 675,000EUR
Område
Zedelgem, West-Vlaanderen
Type
Commercial property
Commercial property in Balen, Antwerp (Province)
 More info
Commercial property in Balen, Antwerp (Province)
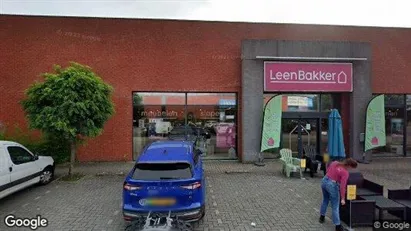
Commercial property for sale in Balen, Antwerp (Province)
Areal
Ca. 955 m2
Pris
Ca. 889,000EUR
Område
Balen, Antwerp (Province)
Type
Commercial property
Commercial property in Ternat, Vlaams-Brabant
 More info
Commercial property in Ternat, Vlaams-Brabant
Commercial property for sale in Ternat, Vlaams-Brabant
Areal
Ca. 1,240 m2
Pris
Ca. 2,290,000EUR
Område
Ternat, Vlaams-Brabant
Type
Commercial property
Commercial property in Stad Gent, Gent
 More info
Commercial property in Stad Gent, Gent
Commercial property for sale in Stad Gent, Gent
Areal
Ca. 845 m2
Pris
Ca. 1,035,000EUR
Område
Stad Gent, Gent
Type
Commercial property
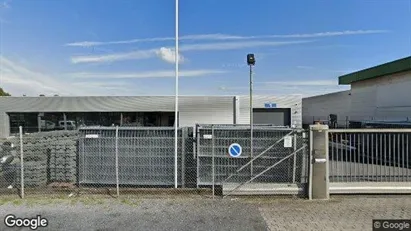
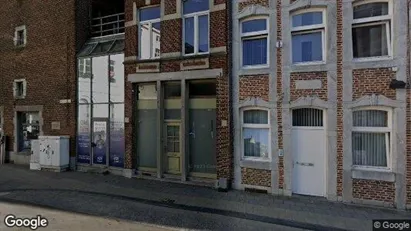
Commercial property in Herstal, Luik (region)
 More info
Commercial property in Herstal, Luik (region)
Commercial property for sale in Herstal, Luik (region)
Areal
Ca. 2,500 m2
Pris
Ca. 1,019,000EUR
Område
Herstal, Luik (region)
Type
Commercial property
Commercial space in Lommel, Limburg
 More info
Commercial space in Lommel, Limburg
Commercial space for rent in Lommel, Limburg
Areal
-
Pris pr. md.
Ca. 17,500 EUR pr md
Område
Lommel, Limburg
Type
Commercial property
Commercial property in Lochristi, Oost-Vlaanderen
 More info
Commercial property in Lochristi, Oost-Vlaanderen
Commercial property for sale in Lochristi, Oost-Vlaanderen
Areal
-
Pris
Ca. 325,000EUR
Område
Lochristi, Oost-Vlaanderen
Type
Commercial property
Commercial property in Sint-Truiden, Limburg
 More info
Commercial property in Sint-Truiden, Limburg
Commercial property for sale in Sint-Truiden, Limburg
Areal
-
Pris
Ca. 390,000EUR
Område
Sint-Truiden, Limburg
Type
Commercial property
Commercial property in Eigenbrakel, Waals-Brabant
 More info
Commercial property in Eigenbrakel, Waals-Brabant
Commercial property for sale in Eigenbrakel, Waals-Brabant
Areal
Ca. 520 m2
Pris
Ca. 897,000EUR
Område
Eigenbrakel, Waals-Brabant
Type
Commercial property
Commercial property in Dendermonde, Oost-Vlaanderen
 More info
Commercial property in Dendermonde, Oost-Vlaanderen
Commercial property for sale in Dendermonde, Oost-Vlaanderen
Areal
-
Pris
Ca. 1,350,000EUR
Område
Dendermonde, Oost-Vlaanderen
Type
Commercial property
Commercial property in Antwerp Wilrijk, Antwerp
 More info
Commercial property in Antwerp Wilrijk, Antwerp
Commercial property for sale in Antwerp Wilrijk, Antwerp
Areal
Ca. 1,605 m2
Pris
Ca. 2,500,000EUR
Område
Antwerp Wilrijk, Antwerp
Type
Commercial property
Commercial property in Meulebeke, West-Vlaanderen
 More info
Commercial property in Meulebeke, West-Vlaanderen
Commercial property for sale in Meulebeke, West-Vlaanderen
Areal
-
Pris
Ca. 246,000EUR
Område
Meulebeke, West-Vlaanderen
Type
Commercial property
Commercial property in Sint-Truiden, Limburg
 More info
Commercial property in Sint-Truiden, Limburg
Commercial property for sale in Sint-Truiden, Limburg
Areal
-
Pris
Ca. 699,000EUR
Område
Sint-Truiden, Limburg
Type
Commercial property
Commercial property in Wingene, West-Vlaanderen
 More info
Commercial property in Wingene, West-Vlaanderen
Commercial property for sale in Wingene, West-Vlaanderen
Areal
Ca. 265 m2
Pris
Ca. 470,000EUR
Område
Wingene, West-Vlaanderen
Type
Commercial property
Commercial property in Temse, Oost-Vlaanderen
 More info
Commercial property in Temse, Oost-Vlaanderen
Commercial property for sale in Temse, Oost-Vlaanderen
Areal
Ca. 755 m2
Pris
Ca. 1,208,000EUR
Område
Temse, Oost-Vlaanderen
Type
Commercial property
Commercial space in Hasselt, Limburg
 More info
Commercial space in Hasselt, Limburg
Commercial space for rent in Hasselt, Limburg
Areal
Ca. 370 m2
Pris pr. md.
Ca. 1,300 EUR pr md
Område
Hasselt, Limburg
Type
Commercial property
Selected customers
30,000 customers use Companyspace.com
30,000 customers
285,000 companies in our database
2,400 rentals annually
Companyspace.com is used by thousands of landlords, property companies, commercial real estate agents, investors and business centres seeking greater visibility, more enquiries and lower vacancy rates.


