


Commercial properties in Belgium
Companyspace.com today:
New today 756
Updated 24h 1,474
Notifications about new companyspaces799
Copenhagen +4
Stockholm +1
Amsterdam +2
Berlin +3
Brussels +4
Vienna +35
Dublin (county) +19
Warsaw +6
Latest update 7 min ago
Active ads 365,539
8,168 commercial properties found
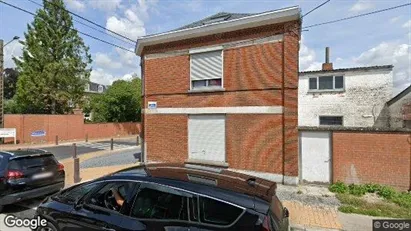
Commercial property in Antwerp Deurne, Antwerp
 More info
Commercial property in Antwerp Deurne, Antwerp
Commercial property for sale in Antwerp Deurne, Antwerp
Areal
-
Pris
Ca. 349,000EUR
Område
Antwerp Deurne, Antwerp
Type
Commercial property
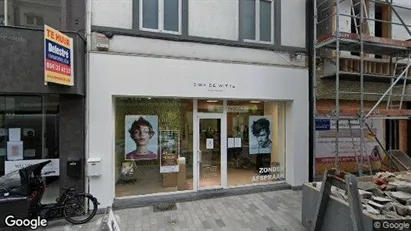
Commercial space in Theux, Luik (region)
 More info
Commercial space in Theux, Luik (region)
Commercial space for rent in Theux, Luik (region)
Areal
-
Pris pr. md.
Ca. 50 EUR per month
Område
Theux, Luik (region)
Type
Commercial property
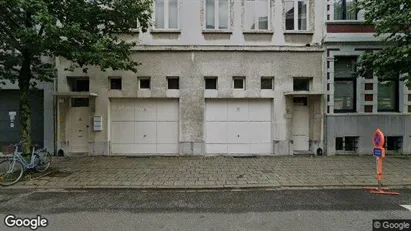
Commercial property in Sint-Pieters-Leeuw, Vlaams-Brabant
 More info
Commercial property in Sint-Pieters-Leeuw, Vlaams-Brabant
Commercial property for sale in Sint-Pieters-Leeuw, Vlaams-Brabant
Areal
Ca. 700 m2
Pris
Ca. 1,300,000EUR
Område
Sint-Pieters-Leeuw, Vlaams-Brabant
Type
Commercial property
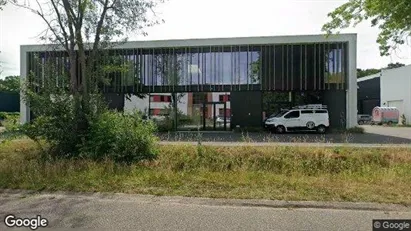
Commercial property in Antwerp Berchem, Antwerp
 More info
Commercial property in Antwerp Berchem, Antwerp
Commercial property for sale in Antwerp Berchem, Antwerp
Areal
-
Pris
Ca. 595,000EUR
Område
Antwerp Berchem, Antwerp
Type
Commercial property
Commercial property in Kortrijk, West-Vlaanderen
 More info
Commercial property in Kortrijk, West-Vlaanderen
Commercial property for sale in Kortrijk, West-Vlaanderen
Areal
Ca. 320 m2
Pris
Ca. 189,000EUR
Område
Kortrijk, West-Vlaanderen
Type
Commercial property
Commercial space in Aalst, Oost-Vlaanderen
 More info
Commercial space in Aalst, Oost-Vlaanderen
Commercial space for rent in Aalst, Oost-Vlaanderen
Areal
-
Pris pr. md.
Ca. 950 EUR per month
Område
Aalst, Oost-Vlaanderen
Type
Commercial property
Commercial property in Roeselare, West-Vlaanderen
 More info
Commercial property in Roeselare, West-Vlaanderen
Commercial property for sale in Roeselare, West-Vlaanderen
Areal
Ca. 1,300 m2
Pris
Ca. 949,000EUR
Område
Roeselare, West-Vlaanderen
Type
Commercial property
Commercial property in Ronse, Oost-Vlaanderen
 More info
Commercial property in Ronse, Oost-Vlaanderen
Commercial property for sale in Ronse, Oost-Vlaanderen
Areal
Ca. 450 m2
Pris
Ca. 450,000EUR
Område
Ronse, Oost-Vlaanderen
Type
Commercial property
Commercial property in Ronse, Oost-Vlaanderen
 More info
Commercial property in Ronse, Oost-Vlaanderen
Commercial property for sale in Ronse, Oost-Vlaanderen
Areal
Ca. 1,500 m2
Pris
Ca. 895,000EUR
Område
Ronse, Oost-Vlaanderen
Type
Commercial property
Commercial property in Antwerp Berchem, Antwerp
 More info
Commercial property in Antwerp Berchem, Antwerp
Commercial property for sale in Antwerp Berchem, Antwerp
Areal
Ca. 35 m2
Pris
Ca. 169,000EUR
Område
Antwerp Berchem, Antwerp
Type
Commercial property
Commercial property in Colfontaine, Henegouwen
 More info
Commercial property in Colfontaine, Henegouwen
Commercial property for sale in Colfontaine, Henegouwen
Areal
-
Pris
Ca. 14,000EUR
Område
Colfontaine, Henegouwen
Type
Commercial property
Commercial property in Aalst, Oost-Vlaanderen
 More info
Commercial property in Aalst, Oost-Vlaanderen
Commercial property for sale in Aalst, Oost-Vlaanderen
Areal
-
Pris
Ca. 269,000EUR
Område
Aalst, Oost-Vlaanderen
Type
Commercial property
Commercial property in Stad Antwerp, Antwerp
 More info
Commercial property in Stad Antwerp, Antwerp
Commercial property for sale in Stad Antwerp, Antwerp
Areal
Ca. 305 m2
Pris
Ca. 1,695,000EUR
Område
Stad Antwerp, Antwerp
Type
Commercial property
Commercial property in Hasselt, Limburg
 More info
Commercial property in Hasselt, Limburg
Commercial property for sale in Hasselt, Limburg
Areal
Ca. 245 m2
Pris
Ca. 374,000EUR
Område
Hasselt, Limburg
Type
Commercial property
Commercial property in Lennik, Vlaams-Brabant
 More info
Commercial property in Lennik, Vlaams-Brabant
Commercial property for sale in Lennik, Vlaams-Brabant
Areal
Ca. 480 m2
Pris
Ca. 835,000EUR
Område
Lennik, Vlaams-Brabant
Type
Commercial property
Commercial property in Sint-Niklaas, Oost-Vlaanderen
 More info
Commercial property in Sint-Niklaas, Oost-Vlaanderen
Commercial property for sale in Sint-Niklaas, Oost-Vlaanderen
Areal
Ca. 1,200 m2
Pris
Ca. 1,535,000EUR
Område
Sint-Niklaas, Oost-Vlaanderen
Type
Commercial property
Commercial property in Brussels Sint-Jans-Molenbeek, Brussels
 More info
Commercial property in Brussels Sint-Jans-Molenbeek, Brussels
Commercial property for sale in Brussels Sint-Jans-Molenbeek, Brussels
Areal
Ca. 150 m2
Pris
Ca. 325,000EUR
Område
Brussels Sint-Jans-Molenbeek, Brussels
Type
Commercial property
Commercial space in Stad Antwerp, Antwerp
 More info
Commercial space in Stad Antwerp, Antwerp
Commercial space for rent in Stad Antwerp, Antwerp
Areal
Ca. 10,000 m2
Pris pr. md.
Ca. 2,900 EUR per month
Område
Stad Antwerp, Antwerp
Type
Commercial property
Selected customers
Selected customers
30,000 customers use Companyspace.com
30,000 customers
285,000 companies in our database
2,400 rentals annually
Companyspace.com is used by thousands of landlords, property companies, commercial real estate agents, investors and business centres seeking greater visibility, more enquiries and lower vacancy rates.


