


Commercial properties in Belgium
Companyspace.com today:
Updated 24h 921
Latest update 1 h ago
Active ads 364,273
8,128 commercial properties found
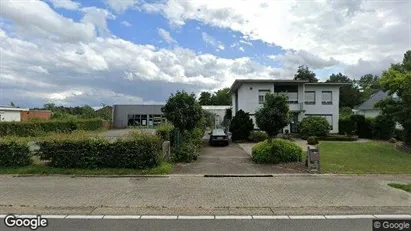
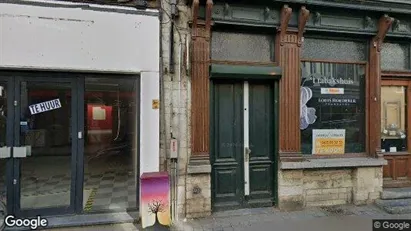
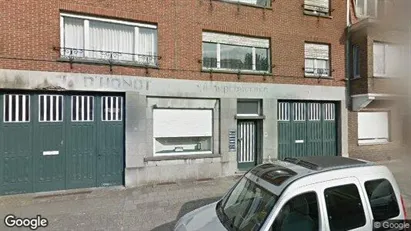
Commercial property in Halle, Vlaams-Brabant
 More info
Commercial property in Halle, Vlaams-Brabant
Commercial property for sale in Halle, Vlaams-Brabant
Areal
-
Pris
Ca. 1,500,000EUR
Område
Halle, Vlaams-Brabant
Type
Commercial property
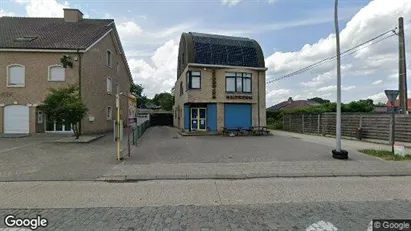
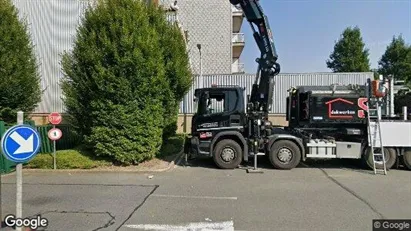
Commercial space in Hasselt, Limburg
 More info
Commercial space in Hasselt, Limburg
Commercial space for rent in Hasselt, Limburg
Areal
Ca. 120 m2
Pris pr. md.
Ca. 8,000 EUR per month
Område
Hasselt, Limburg
Type
Commercial property
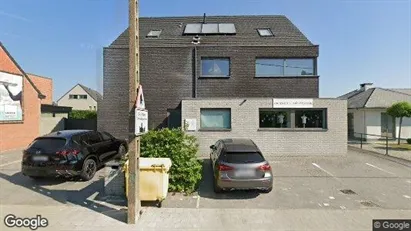
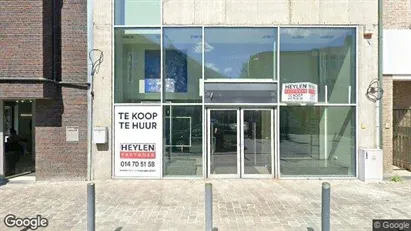
Commercial space in Hasselt, Limburg
 More info
Commercial space in Hasselt, Limburg
Commercial space for rent in Hasselt, Limburg
Areal
Ca. 220 m2
Pris pr. md.
Ca. 1,600 EUR per month
Område
Hasselt, Limburg
Type
Commercial property
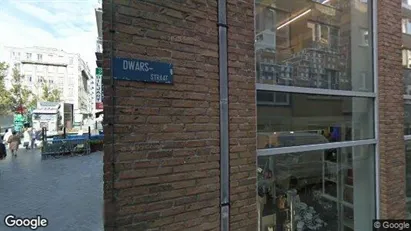
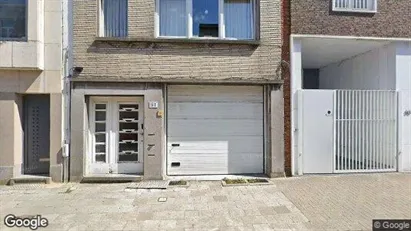
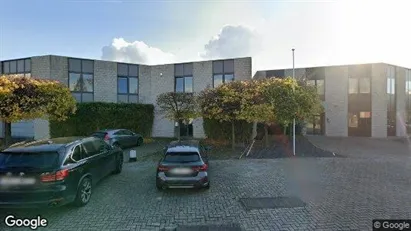
Commercial property in Mol, Antwerp (Province)
 More info
Commercial property in Mol, Antwerp (Province)
Commercial property for sale in Mol, Antwerp (Province)
Areal
-
Pris
Ca. 555,000EUR
Område
Mol, Antwerp (Province)
Type
Commercial property
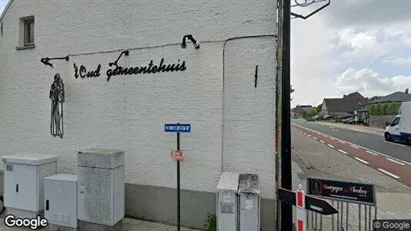
Commercial property in Sint-Katelijne-Waver, Antwerp (Province)
 More info
Commercial property in Sint-Katelijne-Waver, Antwerp (Province)
Commercial property for sale in Sint-Katelijne-Waver, Antwerp (Province)
Areal
Ca. 470 m2
Pris
Ca. 985,000EUR
Område
Sint-Katelijne-Waver, Antwerp (Province)
Type
Commercial property
Commercial space in Oostende, West-Vlaanderen
 More info
Commercial space in Oostende, West-Vlaanderen
Commercial space for rent in Oostende, West-Vlaanderen
Areal
Ca. 10,000 m2
Pris pr. md.
Ca. 3,500 EUR per month
Område
Oostende, West-Vlaanderen
Type
Commercial property
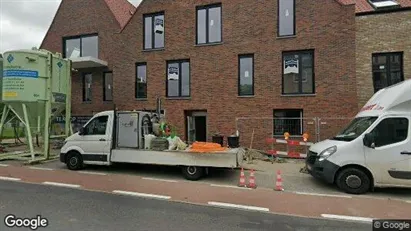
Commercial property in Diest, Vlaams-Brabant
 More info
Commercial property in Diest, Vlaams-Brabant
Commercial property for sale in Diest, Vlaams-Brabant
Areal
-
Pris
Ca. 325,000EUR
Område
Diest, Vlaams-Brabant
Type
Commercial property
Commercial property in Mechelen, Antwerp (Province)
 More info
Commercial property in Mechelen, Antwerp (Province)
Commercial property for sale in Mechelen, Antwerp (Province)
Areal
Ca. 105 m2
Pris
Ca. 589,000EUR
Område
Mechelen, Antwerp (Province)
Type
Commercial property
Commercial property in Antwerp Deurne, Antwerp
 More info
Commercial property in Antwerp Deurne, Antwerp
Commercial property for sale in Antwerp Deurne, Antwerp
Areal
Ca. 125 m2
Pris
Ca. 182,000EUR
Område
Antwerp Deurne, Antwerp
Type
Commercial property
Commercial property in Oostkamp, West-Vlaanderen
 More info
Commercial property in Oostkamp, West-Vlaanderen
Commercial property for sale in Oostkamp, West-Vlaanderen
Areal
-
Pris
Ca. 335,000EUR
Område
Oostkamp, West-Vlaanderen
Type
Commercial property
Commercial property in Menen, West-Vlaanderen
 More info
Commercial property in Menen, West-Vlaanderen
Commercial property for sale in Menen, West-Vlaanderen
Areal
Ca. 195 m2
Pris
Ca. 199,000EUR
Område
Menen, West-Vlaanderen
Type
Commercial property
Commercial property in Brugge, West-Vlaanderen
 More info
Commercial property in Brugge, West-Vlaanderen
Commercial property for sale in Brugge, West-Vlaanderen
Areal
Ca. 175 m2
Pris
Ca. 649,000EUR
Område
Brugge, West-Vlaanderen
Type
Commercial property
Commercial property in Dendermonde, Oost-Vlaanderen
 More info
Commercial property in Dendermonde, Oost-Vlaanderen
Commercial property for sale in Dendermonde, Oost-Vlaanderen
Areal
-
Pris
Ca. 379,000EUR
Område
Dendermonde, Oost-Vlaanderen
Type
Commercial property
Commercial property in Herentals, Antwerp (Province)
 More info
Commercial property in Herentals, Antwerp (Province)
Commercial property for sale in Herentals, Antwerp (Province)
Areal
-
Pris
Ca. 595,000EUR
Område
Herentals, Antwerp (Province)
Type
Commercial property
Commercial property in Mechelen, Antwerp (Province)
 More info
Commercial property in Mechelen, Antwerp (Province)
Commercial property for sale in Mechelen, Antwerp (Province)
Areal
-
Pris
Ca. 1,100,000EUR
Område
Mechelen, Antwerp (Province)
Type
Commercial property
Commercial property in Sint-Truiden, Limburg
 More info
Commercial property in Sint-Truiden, Limburg
Commercial property for sale in Sint-Truiden, Limburg
Areal
Ca. 220 m2
Pris
Ca. 310,000EUR
Område
Sint-Truiden, Limburg
Type
Commercial property
Commercial property in Zwijndrecht, Antwerp (Province)
 More info
Commercial property in Zwijndrecht, Antwerp (Province)
Commercial property for sale in Zwijndrecht, Antwerp (Province)
Areal
-
Pris
Ca. 425,000EUR
Område
Zwijndrecht, Antwerp (Province)
Type
Commercial property
Commercial property in Tongeren, Limburg
 More info
Commercial property in Tongeren, Limburg
Commercial property for sale in Tongeren, Limburg
Areal
-
Pris
Ca. 695,000EUR
Område
Tongeren, Limburg
Type
Commercial property
Selected customers
Selected customers
30,000 customers use Companyspace.com
30,000 customers
285,000 companies in our database
2,400 rentals annually
Companyspace.com is used by thousands of landlords, property companies, commercial real estate agents, investors and business centres seeking greater visibility, more enquiries and lower vacancy rates.


