


Commercial properties in Belgium
Companyspace.com today:
Updated 24h 2,920
Latest update 4 h ago
Active ads 369,199
8,332 commercial properties found
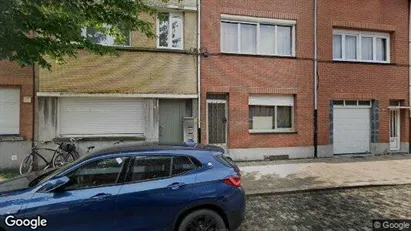
Commercial property in Antwerp Wilrijk, Antwerp
 More info
Commercial property in Antwerp Wilrijk, Antwerp
Commercial property for sale in Antwerp Wilrijk, Antwerp
Areal
-
Pris
Ca. 525,000EUR
Område
Antwerp Wilrijk, Antwerp
Type
Commercial property
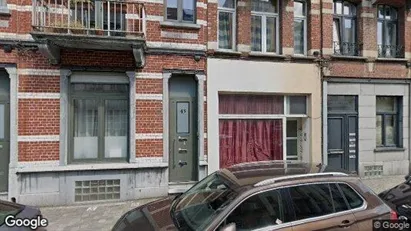
Commercial property in Brussels Schaarbeek, Brussels
 More info
Commercial property in Brussels Schaarbeek, Brussels
Commercial property for sale in Brussels Schaarbeek, Brussels
Areal
-
Pris
Ca. 580,000EUR
Område
Brussels Schaarbeek, Brussels
Type
Commercial property
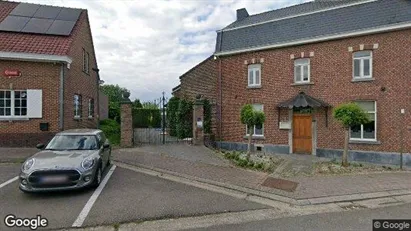
Commercial property in Bilzen, Limburg
 More info
Commercial property in Bilzen, Limburg
Commercial property for sale in Bilzen, Limburg
Areal
-
Pris
Ca. 525,000EUR
Område
Bilzen, Limburg
Type
Commercial property
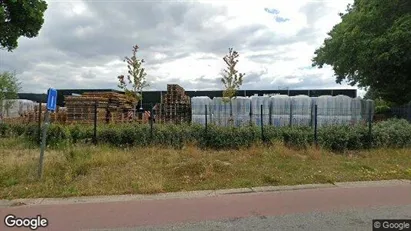
Commercial property in Hasselt, Limburg
 More info
Commercial property in Hasselt, Limburg
Commercial property for sale in Hasselt, Limburg
Areal
-
Pris
Ca. 1,090,000EUR
Område
Hasselt, Limburg
Type
Commercial property
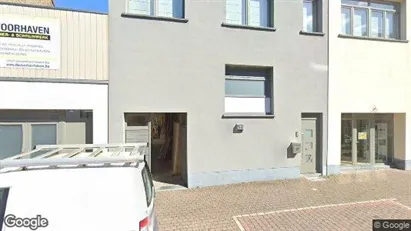
Commercial property in Oostende, West-Vlaanderen
 More info
Commercial property in Oostende, West-Vlaanderen
Commercial property for sale in Oostende, West-Vlaanderen
Areal
-
Pris
Ca. 180,000EUR
Område
Oostende, West-Vlaanderen
Type
Commercial property
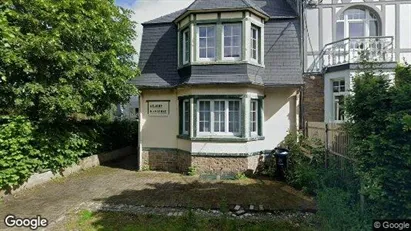
Commercial property in Spa, Luik (region)
 More info
Commercial property in Spa, Luik (region)
Commercial property for sale in Spa, Luik (region)
Areal
Ca. 365 m2
Pris
Ca. 690,000EUR
Område
Spa, Luik (region)
Type
Commercial property
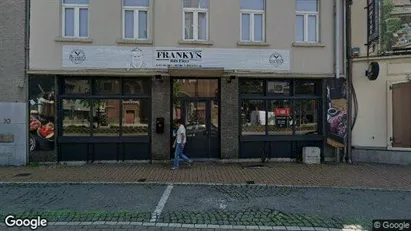
Commercial property in Mol, Antwerp (Province)
 More info
Commercial property in Mol, Antwerp (Province)
Commercial property for sale in Mol, Antwerp (Province)
Areal
Ca. 255 m2
Pris
Ca. 449,000EUR
Område
Mol, Antwerp (Province)
Type
Commercial property
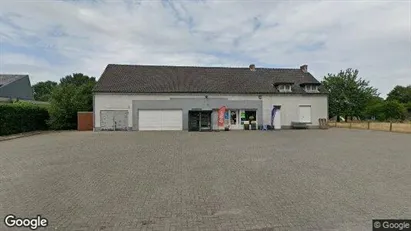
Commercial property in Antwerp Deurne, Antwerp
 More info
Commercial property in Antwerp Deurne, Antwerp
Commercial property for sale in Antwerp Deurne, Antwerp
Areal
-
Pris
Ca. 255,000EUR
Område
Antwerp Deurne, Antwerp
Type
Commercial property
Commercial property in Wevelgem, West-Vlaanderen
 More info
Commercial property in Wevelgem, West-Vlaanderen
Commercial property for sale in Wevelgem, West-Vlaanderen
Areal
-
Pris
Ca. 395,000EUR
Område
Wevelgem, West-Vlaanderen
Type
Commercial property
Commercial property in Heusden-Zolder, Limburg
 More info
Commercial property in Heusden-Zolder, Limburg
Commercial property for sale in Heusden-Zolder, Limburg
Areal
Ca. 480 m2
Pris
Ca. 439,000EUR
Område
Heusden-Zolder, Limburg
Type
Commercial property
Commercial property in Genk, Limburg
 More info
Commercial property in Genk, Limburg
Commercial property for sale in Genk, Limburg
Areal
Ca. 80 m2
Pris
Ca. 120,000EUR
Område
Genk, Limburg
Type
Commercial property
Commercial property in Liedekerke, Vlaams-Brabant
 More info
Commercial property in Liedekerke, Vlaams-Brabant
Commercial property te koop in Liedekerke, Vlaams-Brabant
Areal
Ca. 585 m2
Pris
Ca. 795,000EUR
Område
Liedekerke, Vlaams-Brabant
Type
Commercial property
Commercial space in Aalst, Oost-Vlaanderen
 More info
Commercial space in Aalst, Oost-Vlaanderen
Commercial space te huur in Aalst, Oost-Vlaanderen
Areal
Ca. 100 m2
Pris pr. md.
Ca. 50 EUR pr md
Område
Aalst, Oost-Vlaanderen
Type
Commercial property
Commercial property in Hamont-Achel, Limburg
 More info
Commercial property in Hamont-Achel, Limburg
Commercial property for sale in Hamont-Achel, Limburg
Areal
Ca. 2,575 m2
Pris
Ca. 2,100,000EUR
Område
Hamont-Achel, Limburg
Type
Commercial property
Commercial property in Geel, Antwerp (Province)
 More info
Commercial property in Geel, Antwerp (Province)
Commercial property for sale in Geel, Antwerp (Province)
Areal
Ca. 395 m2
Pris
Ca. 495,000EUR
Område
Geel, Antwerp (Province)
Type
Commercial property
Commercial space in Aalst, Oost-Vlaanderen
 More info
Commercial space in Aalst, Oost-Vlaanderen
Commercial space te huur in Aalst, Oost-Vlaanderen
Areal
Ca. 100 m2
Pris pr. md.
Ca. 850 EUR pr md
Område
Aalst, Oost-Vlaanderen
Type
Commercial property
Commercial property in Herk-de-Stad, Limburg
 More info
Commercial property in Herk-de-Stad, Limburg
Commercial property for sale in Herk-de-Stad, Limburg
Areal
-
Pris
Ca. 360,000EUR
Område
Herk-de-Stad, Limburg
Type
Commercial property
Commercial property in Houthulst, West-Vlaanderen
 More info
Commercial property in Houthulst, West-Vlaanderen
Commercial property for sale in Houthulst, West-Vlaanderen
Areal
-
Pris
Ca. 495,000EUR
Område
Houthulst, West-Vlaanderen
Type
Commercial property
Selected customers
30,000 customers use Companyspace.com
30,000 customers
285,000 companies in our database
2,400 rentals annually
Companyspace.com is used by thousands of landlords, property companies, commercial real estate agents, investors and business centres seeking greater visibility, more enquiries and lower vacancy rates.


