Available commercial properties in Belgium
See all available commercial properties in Belgium below. If you are looking for commercial property in Belgium, you have come to the right place. We have most available commercial properties in Belgium in our database. Find commercial property in Belgium here. Enjoy.
5,829 commercial properties found
-
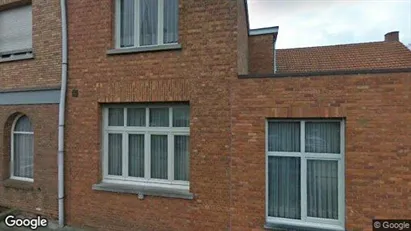
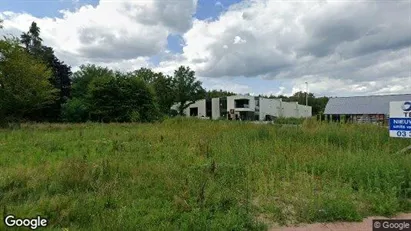
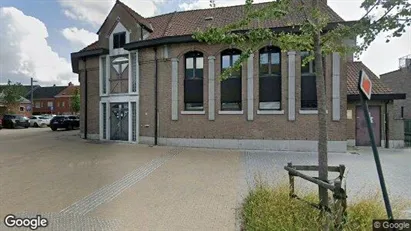
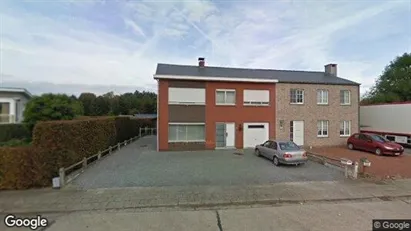
Ca. 100 m2 commercial space for rent in Kasterlee, Antwerp (Province)
- Ca. 1,100 EUR per month
- Ca. 150 EUR /m2/year
-
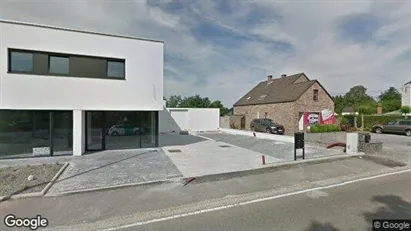
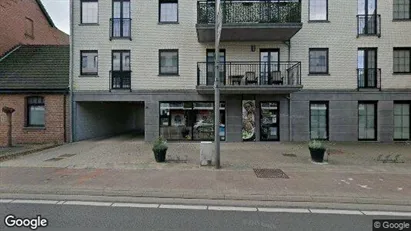
Ca. 75 m2 commercial space for rent in Westerlo, Antwerp (Province)
- Ca. 950 EUR per month
- Ca. 150 EUR /m2/year
-
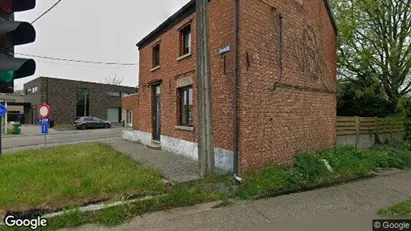
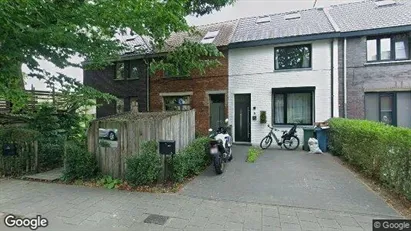
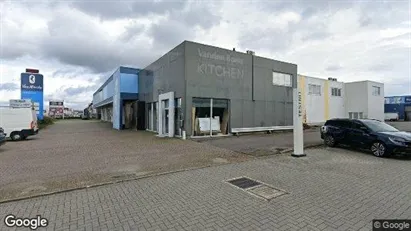
Ca. 145 m2 commercial space for rent in Turnhout, Antwerp (Province)
- Ca. 1,000 EUR per month
- Ca. 100 EUR /m2/year
-
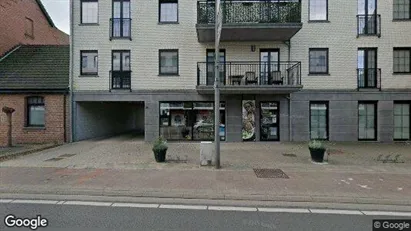
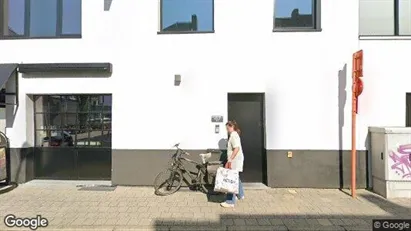
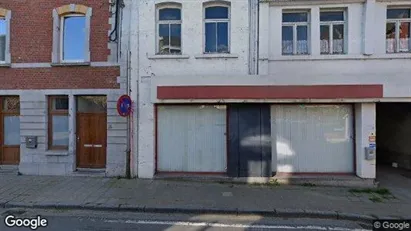
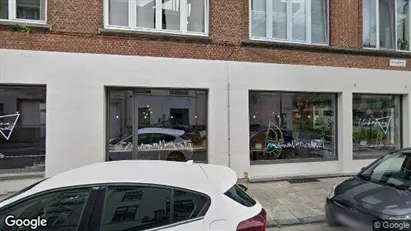
Ca. 60 m2 commercial space for rent in Antwerp Borgerhout, Antwerp
- Ca. 850 EUR per month
- Ca. 150 EUR /m2/year
-
Ca. 225 m2 commercial space for rent in Schilde, Antwerp (Province)
- Ca. 3,500 EUR per month
- Ca. 200 EUR /m2/year
-
Ca. 100 m2 commercial space for rent in Kasterlee, Antwerp (Province)
- Ca. 800 EUR per month
- Ca. 100 EUR /m2/year
-
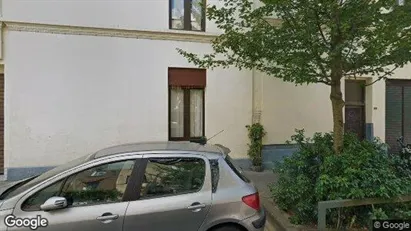
Ca. 60 m2 commercial space for rent in Antwerp Ekeren, Antwerp
- Ca. 750 EUR per month
- Ca. 150 EUR /m2/year
-
Ca. 80 m2 commercial space for rent in Heist-op-den-Berg, Antwerp (Province)
- Ca. 950 EUR per month
- Ca. 150 EUR /m2/year
-
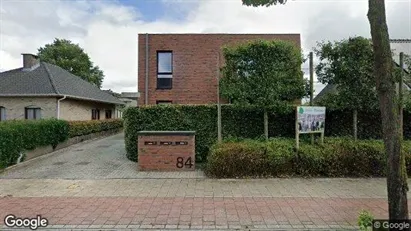
Ca. 100 m2 commercial space for rent in Malle, Antwerp (Province)
- Ca. 1,000 EUR per month
- Ca. 100 EUR /m2/year
-
Ca. 905 m2 commercial space for rent in Aartselaar, Antwerp (Province)
- Ca. 3,600 EUR per month
- Ca. 50 EUR /m2/year
Frequently asked questions
Statistics on the development of available commercial properties for rent in Belgium over the past month
Also see aggregate statistics on all available commercial properties in Belgium over time, aggregate statistics on new commercial properties in Belgium over time, aggregate statistics on rented commercial properties in Belgium over time
| Date | |||
|---|---|---|---|
| 5. February 2026 | 5379 | 100 | 96 |
| 4. February 2026 | 5375 | 163 | 567 |
| 3. February 2026 | 5779 | 74 | 77 |
| 2. February 2026 | 5782 | 354 | 429 |
| 1. February 2026 | 5857 | 272 | 0 |
| 31. January 2026 | 5585 | 352 | 287 |
| 30. January 2026 | 5520 | 217 | 336 |
| 29. January 2026 | 5639 | 98 | 64 |
| 28. January 2026 | 5605 | 17 | 283 |
| 27. January 2026 | 5871 | 248 | 235 |
| 26. January 2026 | 5858 | 116 | 22 |
| 25. January 2026 | 5764 | 333 | 251 |
| 24. January 2026 | 5682 | 244 | 0 |
| 23. January 2026 | 5438 | 56 | 156 |
| 22. January 2026 | 5538 | 165 | 491 |
| 21. January 2026 | 5864 | 4 | 24 |
| 20. January 2026 | 5884 | 256 | 140 |
| 19. January 2026 | 5768 | 236 | 340 |
| 18. January 2026 | 5872 | 210 | 0 |
| 17. January 2026 | 5662 | 176 | 301 |
| 16. January 2026 | 5787 | 420 | 140 |
| 15. January 2026 | 5507 | 38 | 6 |
| 14. January 2026 | 5475 | 272 | 186 |
| 13. January 2026 | 5389 | 92 | 298 |
| 12. January 2026 | 5595 | 28 | 209 |
| 11. January 2026 | 5776 | 507 | 219 |
| 10. January 2026 | 5488 | 117 | 59 |
| 9. January 2026 | 5430 | 226 | 299 |
| 8. January 2026 | 5503 | 263 | 113 |
| 7. January 2026 | 5353 | 288 | 255 |
| 6. January 2026 | 5320 | 870 | 0 |
Statistics on currently available commercial properties in Belgium
Also see gathered statistics of all available commercial properties over time, the gathered statistics of new commercial properties over time, the gathered statistics of rented commercial properties over time
| Commercial properties | |
|---|---|
| Available premises | 5,811 |
| New premises since yesterday | 100 |
| Rented out premises since yesterday | 96 |
| Total available m2 | 5,262,873 |
| Average price per m2 per year without expenses | 655 |
| Highest price per m2 per year | 49,560 |
| Lowest price per m2 per year | 1.1 |


