


Commercial properties in Belgium
Companyspace.com today:
New today 1,111
Updated 24h 1,132
Notifications about new companyspaces1,955
Copenhagen +54
Stockholm +5
Amsterdam +29
Berlin +2
Brussels +3
Vienna +37
Paris +7
Madrid +4
Dublin (county) +4
Warsaw +7
Roma (region) +1
Latest update 1 min ago
Active ads 365,796
7,978 commercial properties found
Commercial property in Landen, Vlaams-Brabant
 More info
Commercial property in Landen, Vlaams-Brabant
Commercial property for sale in Landen, Vlaams-Brabant
Areal
Ca. 2,230 m2
Pris
Ca. 1,375,000EUR
Område
Landen, Vlaams-Brabant
Type
Commercial property
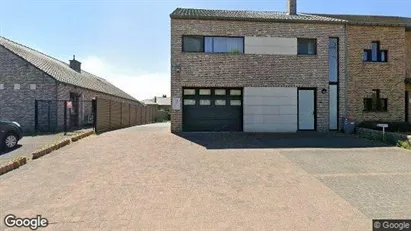
Commercial property in Aartselaar, Antwerp (Province)
 More info
Commercial property in Aartselaar, Antwerp (Province)
Commercial property te koop in Aartselaar, Antwerp (Province)
Areal
Ca. 120 m2
Pris
Ca. 399,000EUR
Område
Aartselaar, Antwerp (Province)
Type
Commercial property
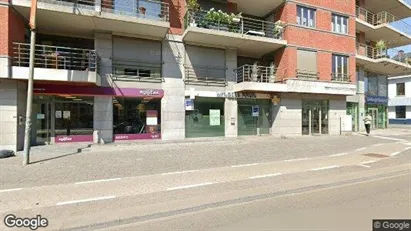
Commercial property in Wezet, Luik (region)
 More info
Commercial property in Wezet, Luik (region)
Commercial property for sale in Wezet, Luik (region)
Areal
-
Pris
Ca. 295,000EUR
Område
Wezet, Luik (region)
Type
Commercial property
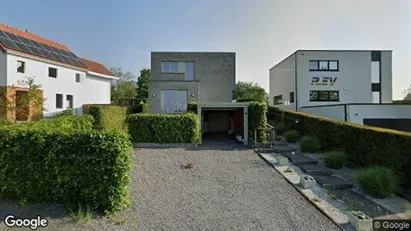
Commercial space in Stad Gent, Gent
 More info
Commercial space in Stad Gent, Gent
Commercial space for rent in Stad Gent, Gent
Areal
Ca. 230 m2
Pris pr. md.
Ca. 200 EUR pr md
Område
Stad Gent, Gent
Type
Commercial property
Commercial property in Beersel, Vlaams-Brabant
 More info
Commercial property in Beersel, Vlaams-Brabant
Commercial property for sale in Beersel, Vlaams-Brabant
Areal
-
Pris
Ca. 459,000EUR
Område
Beersel, Vlaams-Brabant
Type
Commercial property
Commercial property in Bilzen, Limburg
 More info
Commercial property in Bilzen, Limburg
Commercial property for sale in Bilzen, Limburg
Areal
-
Pris
Ca. 545,000EUR
Område
Bilzen, Limburg
Type
Commercial property
Commercial property in Hasselt, Limburg
 More info
Commercial property in Hasselt, Limburg
Commercial property for sale in Hasselt, Limburg
Areal
-
Pris
Ca. 570,000EUR
Område
Hasselt, Limburg
Type
Commercial property
Commercial property in Dilbeek, Vlaams-Brabant
 More info
Commercial property in Dilbeek, Vlaams-Brabant
Commercial property for sale in Dilbeek, Vlaams-Brabant
Areal
-
Pris
Ca. 590,000EUR
Område
Dilbeek, Vlaams-Brabant
Type
Commercial property
Commercial property in Brussels Schaarbeek, Brussels
 More info
Commercial property in Brussels Schaarbeek, Brussels
Commercial property for sale in Brussels Schaarbeek, Brussels
Areal
-
Pris
Ca. 225,000EUR
Område
Brussels Schaarbeek, Brussels
Type
Commercial property
Commercial property in Brussels Etterbeek, Brussels
 More info
Commercial property in Brussels Etterbeek, Brussels
Commercial property for sale in Brussels Etterbeek, Brussels
Areal
-
Pris
Ca. 1,050,000EUR
Område
Brussels Etterbeek, Brussels
Type
Commercial property
Commercial property in Brugge, West-Vlaanderen
 More info
Commercial property in Brugge, West-Vlaanderen
Commercial property for sale in Brugge, West-Vlaanderen
Areal
-
Pris
Ca. 650,000EUR
Område
Brugge, West-Vlaanderen
Type
Commercial property
Commercial property in Antwerp Wilrijk, Antwerp
 More info
Commercial property in Antwerp Wilrijk, Antwerp
Commercial property for sale in Antwerp Wilrijk, Antwerp
Areal
-
Pris
Ca. 500,000EUR
Område
Antwerp Wilrijk, Antwerp
Type
Commercial property
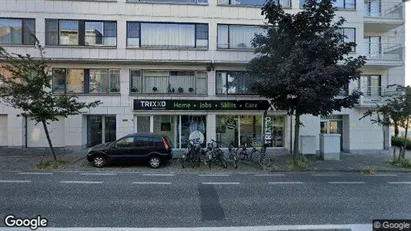
Commercial space in Aalst, Oost-Vlaanderen
 More info
Commercial space in Aalst, Oost-Vlaanderen
Commercial space for rent in Aalst, Oost-Vlaanderen
Areal
-
Pris pr. md.
Ca. 700 EUR pr md
Område
Aalst, Oost-Vlaanderen
Type
Commercial property
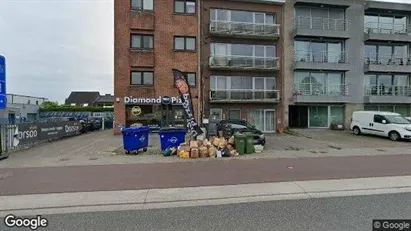
Commercial space in Maasmechelen, Limburg
 More info
Commercial space in Maasmechelen, Limburg
Commercial space for rent in Maasmechelen, Limburg
Areal
-
Pris pr. md.
Ca. 3,750 EUR pr md
Område
Maasmechelen, Limburg
Type
Commercial property
Commercial space in Merksplas, Antwerp (Province)
 More info
Commercial space in Merksplas, Antwerp (Province)
Commercial space for rent in Merksplas, Antwerp (Province)
Areal
Ca. 105 m2
Pris pr. md.
Ca. 900 EUR pr md
Område
Merksplas, Antwerp (Province)
Type
Commercial property
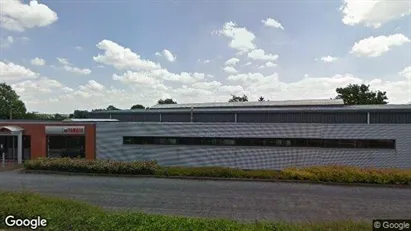
Commercial property in Hasselt, Limburg
 More info
Commercial property in Hasselt, Limburg
Commercial property for sale in Hasselt, Limburg
Areal
Ca. 2,260 m2
Pris
Ca. 845,000EUR
Område
Hasselt, Limburg
Type
Commercial property
Commercial property in Zwevegem, West-Vlaanderen
 More info
Commercial property in Zwevegem, West-Vlaanderen
Commercial property for sale in Zwevegem, West-Vlaanderen
Areal
Ca. 220 m2
Pris
Ca. 291,000EUR
Område
Zwevegem, West-Vlaanderen
Type
Commercial property
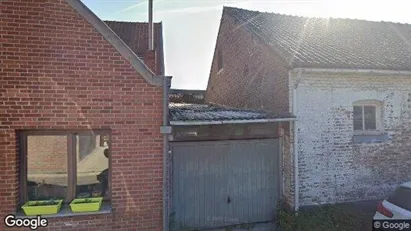
Commercial property in Scherpenheuvel-Zichem, Vlaams-Brabant
 More info
Commercial property in Scherpenheuvel-Zichem, Vlaams-Brabant
Commercial property for sale in Scherpenheuvel-Zichem, Vlaams-Brabant
Areal
Ca. 645 m2
Pris
Ca. 719,000EUR
Område
Scherpenheuvel-Zichem, Vlaams-Brabant
Type
Commercial property
Selected customers
30,000 customers use Companyspace.com
30,000 customers
285,000 companies in our database
2,400 rentals annually
Companyspace.com is used by thousands of landlords, property companies, commercial real estate agents, investors and business centres seeking greater visibility, more enquiries and lower vacancy rates.


