


Commercial properties in Belgium
Companyspace.com today:
New today 343
Updated 24h 1,236
Notifications about new companyspaces6
Copenhagen +1
Stockholm +1
Amsterdam +11
Berlin +2
Brussels +5
Vienna +10
Dublin (county) +1
Lisbon +1
Latest update 1 min ago
Active ads 368,501
8,354 commercial properties found
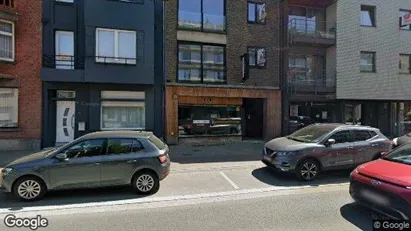
Commercial property in Antwerp Hoboken, Antwerp
 More info
Commercial property in Antwerp Hoboken, Antwerp
Commercial property for sale in Antwerp Hoboken, Antwerp
Areal
Ca. 595 m2
Pris
Ca. 986,000EUR
Område
Antwerp Hoboken, Antwerp
Type
Commercial property
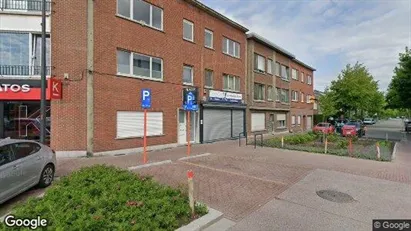
Commercial property in Maaseik, Limburg
 More info
Commercial property in Maaseik, Limburg
Commercial property for sale in Maaseik, Limburg
Areal
-
Pris
Ca. 290,000EUR
Område
Maaseik, Limburg
Type
Commercial property
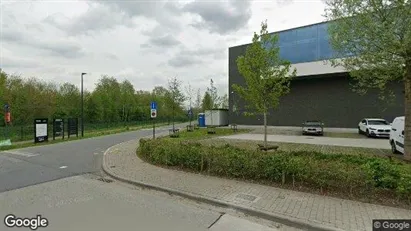
Commercial property in Hasselt, Limburg
 More info
Commercial property in Hasselt, Limburg
Commercial property for sale in Hasselt, Limburg
Areal
Ca. 500 m2
Pris
Ca. 1,790,000EUR
Område
Hasselt, Limburg
Type
Commercial property
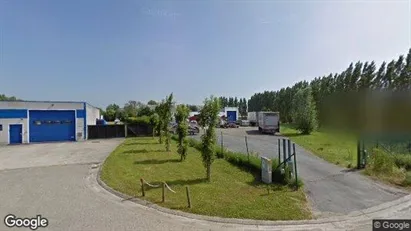
Commercial property in Mechelen, Antwerp (Province)
 More info
Commercial property in Mechelen, Antwerp (Province)
Commercial property for sale in Mechelen, Antwerp (Province)
Areal
Ca. 260 m2
Pris
Ca. 695,000EUR
Område
Mechelen, Antwerp (Province)
Type
Commercial property
Commercial property in Harelbeke, West-Vlaanderen
 More info
Commercial property in Harelbeke, West-Vlaanderen
Commercial property for sale in Harelbeke, West-Vlaanderen
Areal
Ca. 310 m2
Pris
Ca. 605,000EUR
Område
Harelbeke, West-Vlaanderen
Type
Commercial property
Commercial property in Herentals, Antwerp (Province)
 More info
Commercial property in Herentals, Antwerp (Province)
Commercial property for sale in Herentals, Antwerp (Province)
Areal
Ca. 120 m2
Pris
Ca. 209,000EUR
Område
Herentals, Antwerp (Province)
Type
Commercial property
Commercial property in Stad Brussel, Brussels
 More info
Commercial property in Stad Brussel, Brussels
Commercial property for sale in Stad Brussel, Brussels
Areal
-
Pris
Ca. 295,000EUR
Område
Stad Brussel, Brussels
Type
Commercial property
Commercial property in Kontich, Antwerp (Province)
 More info
Commercial property in Kontich, Antwerp (Province)
Commercial property for sale in Kontich, Antwerp (Province)
Areal
Ca. 155 m2
Pris
Ca. 299,000EUR
Område
Kontich, Antwerp (Province)
Type
Commercial property
Commercial property in Aalst, Oost-Vlaanderen
 More info
Commercial property in Aalst, Oost-Vlaanderen
Commercial property for sale in Aalst, Oost-Vlaanderen
Areal
Ca. 560 m2
Pris
Ca. 885,000EUR
Område
Aalst, Oost-Vlaanderen
Type
Commercial property
Commercial property in Oostende, West-Vlaanderen
 More info
Commercial property in Oostende, West-Vlaanderen
Commercial property for sale in Oostende, West-Vlaanderen
Areal
Ca. 2,935 m2
Pris
Ca. 1,200,000EUR
Område
Oostende, West-Vlaanderen
Type
Commercial property
Commercial property in Oostende, West-Vlaanderen
 More info
Commercial property in Oostende, West-Vlaanderen
Commercial property for sale in Oostende, West-Vlaanderen
Areal
-
Pris
Ca. 145,000EUR
Område
Oostende, West-Vlaanderen
Type
Commercial property
Commercial property in Haaltert, Oost-Vlaanderen
 More info
Commercial property in Haaltert, Oost-Vlaanderen
Commercial property for sale in Haaltert, Oost-Vlaanderen
Areal
Ca. 535 m2
Pris
Ca. 599,000EUR
Område
Haaltert, Oost-Vlaanderen
Type
Commercial property
Commercial property in Brasschaat, Antwerp (Province)
 More info
Commercial property in Brasschaat, Antwerp (Province)
Commercial property for sale in Brasschaat, Antwerp (Province)
Areal
-
Pris
Ca. 295,000EUR
Område
Brasschaat, Antwerp (Province)
Type
Commercial property
Commercial property in Oostkamp, West-Vlaanderen
 More info
Commercial property in Oostkamp, West-Vlaanderen
Commercial property for sale in Oostkamp, West-Vlaanderen
Areal
-
Pris
Ca. 896,000EUR
Område
Oostkamp, West-Vlaanderen
Type
Commercial property
Commercial property in Ranst, Antwerp (Province)
 More info
Commercial property in Ranst, Antwerp (Province)
Commercial property for sale in Ranst, Antwerp (Province)
Areal
-
Pris
Ca. 995,000EUR
Område
Ranst, Antwerp (Province)
Type
Commercial property
Commercial property in Charleroi, Henegouwen
 More info
Commercial property in Charleroi, Henegouwen
Commercial property for sale in Charleroi, Henegouwen
Areal
Ca. 255 m2
Pris
Ca. 250,000EUR
Område
Charleroi, Henegouwen
Type
Commercial property
Commercial property in Heist-op-den-Berg, Antwerp (Province)
 More info
Commercial property in Heist-op-den-Berg, Antwerp (Province)
Commercial property for sale in Heist-op-den-Berg, Antwerp (Province)
Areal
Ca. 2,150 m2
Pris
Ca. 3,603,000EUR
Område
Heist-op-den-Berg, Antwerp (Province)
Type
Commercial property
Commercial property in Bouillon, Luxemburg (Provincie)
 More info
Commercial property in Bouillon, Luxemburg (Provincie)
Commercial property for sale in Bouillon, Luxemburg (Provincie)
Areal
Ca. 365 m2
Pris
Ca. 179,000EUR
Område
Bouillon, Luxemburg (Provincie)
Type
Commercial property
Selected customers
30,000 customers use Companyspace.com
30,000 customers
285,000 companies in our database
2,400 rentals annually
Companyspace.com is used by thousands of landlords, property companies, commercial real estate agents, investors and business centres seeking greater visibility, more enquiries and lower vacancy rates.


