


Commercial properties in Belgium
Companyspace.com today:
New today 1
Updated 24h 375
Latest update 10 min ago
Active ads 365,974
8,170 commercial properties found
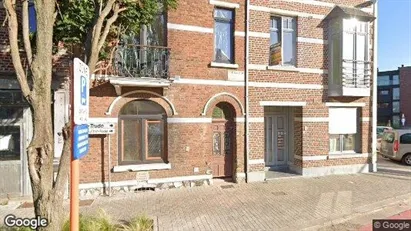
Commercial property in Deinze, Oost-Vlaanderen
 More info
Commercial property in Deinze, Oost-Vlaanderen
Commercial property for sale in Deinze, Oost-Vlaanderen
Areal
Ca. 110 m2
Pris
Ca. 395,000EUR
Område
Deinze, Oost-Vlaanderen
Type
Commercial property
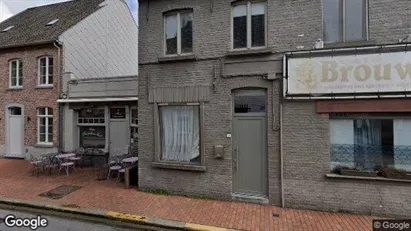
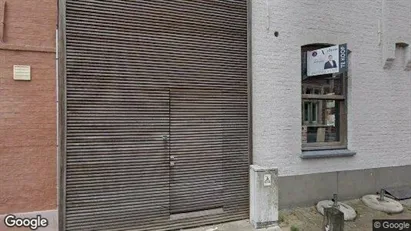
Commercial property in Ronse, Oost-Vlaanderen
 More info
Commercial property in Ronse, Oost-Vlaanderen
Commercial property for sale in Ronse, Oost-Vlaanderen
Areal
Ca. 340 m2
Pris
Ca. 345,000EUR
Område
Ronse, Oost-Vlaanderen
Type
Commercial property
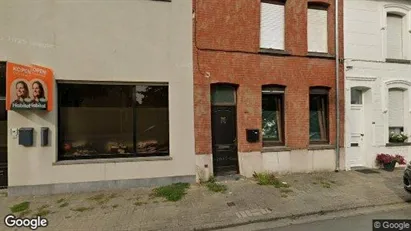
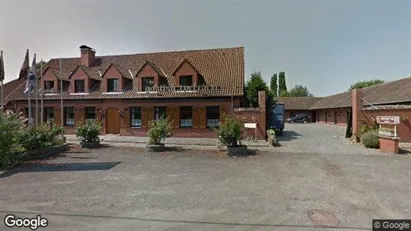
Commercial property in Balen, Antwerp (Province)
 More info
Commercial property in Balen, Antwerp (Province)
Commercial property for sale in Balen, Antwerp (Province)
Areal
Ca. 95 m2
Pris
Ca. 184,000EUR
Område
Balen, Antwerp (Province)
Type
Commercial property
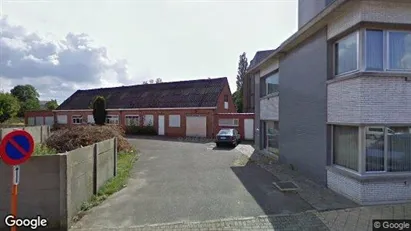
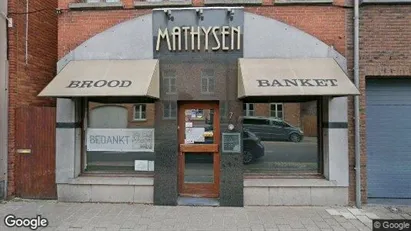
Commercial property in Izegem, West-Vlaanderen
 More info
Commercial property in Izegem, West-Vlaanderen
Commercial property for sale in Izegem, West-Vlaanderen
Areal
Ca. 225 m2
Pris
Ca. 350,000EUR
Område
Izegem, West-Vlaanderen
Type
Commercial property
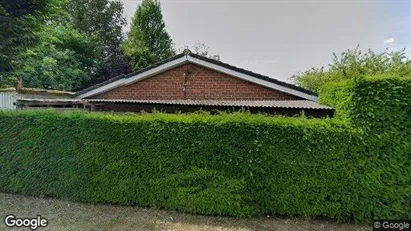
Commercial property in Moorslede, West-Vlaanderen
 More info
Commercial property in Moorslede, West-Vlaanderen
Commercial property for sale in Moorslede, West-Vlaanderen
Areal
Ca. 235 m2
Pris
Ca. 307,000EUR
Område
Moorslede, West-Vlaanderen
Type
Commercial property
Commercial property in Vielsalm, Luxemburg (Provincie)
 More info
Commercial property in Vielsalm, Luxemburg (Provincie)
Commercial property for sale in Vielsalm, Luxemburg (Provincie)
Areal
Ca. 60 m2
Pris
Ca. 149,000EUR
Område
Vielsalm, Luxemburg (Provincie)
Type
Commercial property
Commercial property in Sint-Truiden, Limburg
 More info
Commercial property in Sint-Truiden, Limburg
Commercial property for sale in Sint-Truiden, Limburg
Areal
Ca. 320 m2
Pris
Ca. 1,050,000EUR
Område
Sint-Truiden, Limburg
Type
Commercial property
Commercial property in Moorslede, West-Vlaanderen
 More info
Commercial property in Moorslede, West-Vlaanderen
Commercial property for sale in Moorslede, West-Vlaanderen
Areal
Ca. 770 m2
Pris
Ca. 475,000EUR
Område
Moorslede, West-Vlaanderen
Type
Commercial property
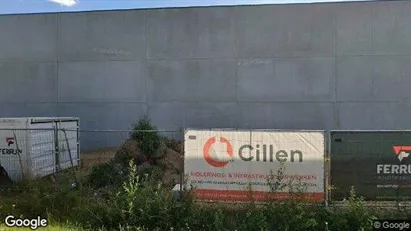
Commercial property in Kruisem, Oost-Vlaanderen
 More info
Commercial property in Kruisem, Oost-Vlaanderen
Commercial property for sale in Kruisem, Oost-Vlaanderen
Areal
Ca. 8,090 m2
Pris
Ca. 1,250,000EUR
Område
Kruisem, Oost-Vlaanderen
Type
Commercial property
Commercial property in Hoogstraten, Antwerp (Province)
 More info
Commercial property in Hoogstraten, Antwerp (Province)
Commercial property for sale in Hoogstraten, Antwerp (Province)
Areal
Ca. 150 m2
Pris
Ca. 255,000EUR
Område
Hoogstraten, Antwerp (Province)
Type
Commercial property
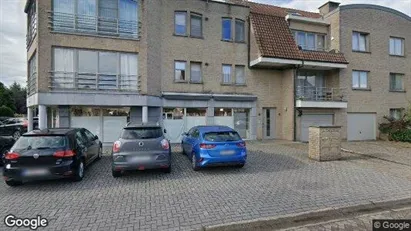
Commercial property in Evergem, Oost-Vlaanderen
 More info
Commercial property in Evergem, Oost-Vlaanderen
Commercial property for sale in Evergem, Oost-Vlaanderen
Areal
Ca. 130 m2
Pris
Ca. 231,000EUR
Område
Evergem, Oost-Vlaanderen
Type
Commercial property
Commercial property in Wuustwezel, Antwerp (Province)
 More info
Commercial property in Wuustwezel, Antwerp (Province)
Commercial property for sale in Wuustwezel, Antwerp (Province)
Areal
Ca. 240 m2
Pris
Ca. 399,000EUR
Område
Wuustwezel, Antwerp (Province)
Type
Commercial property
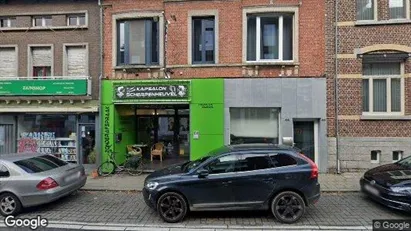
Commercial property in Scherpenheuvel-Zichem, Vlaams-Brabant
 More info
Commercial property in Scherpenheuvel-Zichem, Vlaams-Brabant
Commercial property for sale in Scherpenheuvel-Zichem, Vlaams-Brabant
Areal
Ca. 140 m2
Pris
Ca. 399,000EUR
Område
Scherpenheuvel-Zichem, Vlaams-Brabant
Type
Commercial property
Commercial property in As, Limburg
 More info
Commercial property in As, Limburg
Commercial property for sale in As, Limburg
Areal
Ca. 215 m2
Pris
Ca. 330,000EUR
Område
As, Limburg
Type
Commercial property
Commercial property in Genk, Limburg
 More info
Commercial property in Genk, Limburg
Commercial property for sale in Genk, Limburg
Areal
Ca. 500 m2
Pris
Ca. 570,000EUR
Område
Genk, Limburg
Type
Commercial property
Commercial property in Baarle-Hertog, Antwerp (Province)
 More info
Commercial property in Baarle-Hertog, Antwerp (Province)
Commercial property for sale in Baarle-Hertog, Antwerp (Province)
Areal
Ca. 2,825 m2
Pris
Ca. 1,150,000EUR
Område
Baarle-Hertog, Antwerp (Province)
Type
Commercial property
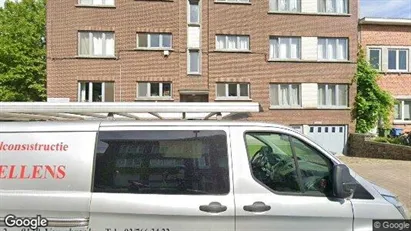
Commercial property in Antwerp Deurne, Antwerp
 More info
Commercial property in Antwerp Deurne, Antwerp
Commercial property for sale in Antwerp Deurne, Antwerp
Areal
Ca. 475 m2
Pris
Ca. 328,000EUR
Område
Antwerp Deurne, Antwerp
Type
Commercial property
Commercial property in Maasmechelen, Limburg
 More info
Commercial property in Maasmechelen, Limburg
Commercial property for sale in Maasmechelen, Limburg
Areal
Ca. 340 m2
Pris
Ca. 295,000EUR
Område
Maasmechelen, Limburg
Type
Commercial property
Selected customers
30,000 customers use Companyspace.com
30,000 customers
285,000 companies in our database
2,400 rentals annually
Companyspace.com is used by thousands of landlords, property companies, commercial real estate agents, investors and business centres seeking greater visibility, more enquiries and lower vacancy rates.


