


Commercial properties in Belgium
Companyspace.com today:
New today 379
Updated 24h 1,047
Notifications about new companyspaces103
Stockholm +1
Amsterdam +5
Berlin +5
Brussels +2
Vienna +3
Warsaw +15
Roma (region) +3
Lisbon +1
Latest update 1 min ago
Active ads 365,409
8,228 commercial properties found
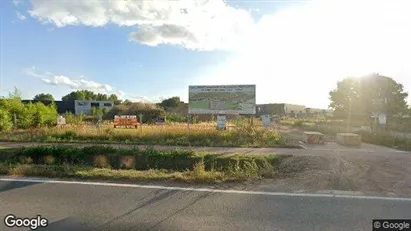
Commercial property in Duffel, Antwerp (Province)
 More info
Commercial property in Duffel, Antwerp (Province)
Commercial property for sale in Duffel, Antwerp (Province)
Areal
Ca. 2,420 m2
Pris
Ca. 2,995,000EUR
Område
Duffel, Antwerp (Province)
Type
Commercial property
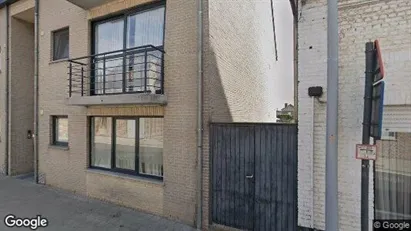
Commercial property in Ranst, Antwerp (Province)
 More info
Commercial property in Ranst, Antwerp (Province)
Commercial property for sale in Ranst, Antwerp (Province)
Areal
Ca. 180 m2
Pris
Ca. 312,000EUR
Område
Ranst, Antwerp (Province)
Type
Commercial property
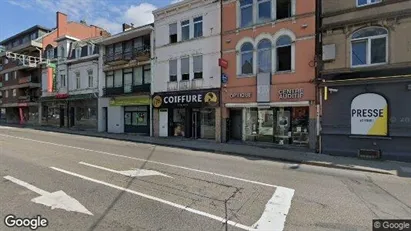
Commercial property in Kortrijk, West-Vlaanderen
 More info
Commercial property in Kortrijk, West-Vlaanderen
Commercial property for sale in Kortrijk, West-Vlaanderen
Areal
Ca. 750 m2
Pris
Ca. 1,069,000EUR
Område
Kortrijk, West-Vlaanderen
Type
Commercial property
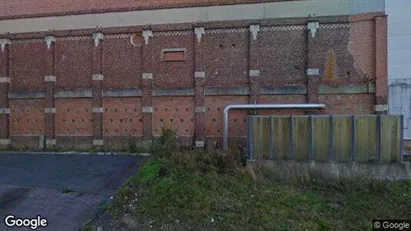
Commercial property in Dentergem, West-Vlaanderen
 More info
Commercial property in Dentergem, West-Vlaanderen
Commercial property for sale in Dentergem, West-Vlaanderen
Areal
Ca. 275 m2
Pris
Ca. 415,000EUR
Område
Dentergem, West-Vlaanderen
Type
Commercial property
Commercial property in Zedelgem, West-Vlaanderen
 More info
Commercial property in Zedelgem, West-Vlaanderen
Commercial property for sale in Zedelgem, West-Vlaanderen
Areal
Ca. 225 m2
Pris
Ca. 343,000EUR
Område
Zedelgem, West-Vlaanderen
Type
Commercial property
Commercial property in Oostende, West-Vlaanderen
 More info
Commercial property in Oostende, West-Vlaanderen
Commercial property for sale in Oostende, West-Vlaanderen
Areal
Ca. 385 m2
Pris
Ca. 600,000EUR
Område
Oostende, West-Vlaanderen
Type
Commercial property
Commercial property in Andenne, Namen (region)
 More info
Commercial property in Andenne, Namen (region)
Commercial property for sale in Andenne, Namen (region)
Areal
Ca. 165 m2
Pris
Ca. 289,000EUR
Område
Andenne, Namen (region)
Type
Commercial property
Commercial property in Deerlijk, West-Vlaanderen
 More info
Commercial property in Deerlijk, West-Vlaanderen
Commercial property for sale in Deerlijk, West-Vlaanderen
Areal
Ca. 775 m2
Pris
Ca. 745,000EUR
Område
Deerlijk, West-Vlaanderen
Type
Commercial property
Commercial property in Hasselt, Limburg
 More info
Commercial property in Hasselt, Limburg
Commercial property for sale in Hasselt, Limburg
Areal
Ca. 290 m2
Pris
Ca. 376,000EUR
Område
Hasselt, Limburg
Type
Commercial property
Commercial property in Geraardsbergen, Oost-Vlaanderen
 More info
Commercial property in Geraardsbergen, Oost-Vlaanderen
Commercial property for sale in Geraardsbergen, Oost-Vlaanderen
Areal
-
Pris
Ca. 259,000EUR
Område
Geraardsbergen, Oost-Vlaanderen
Type
Commercial property
Commercial property in Hasselt, Limburg
 More info
Commercial property in Hasselt, Limburg
Commercial property for sale in Hasselt, Limburg
Areal
Ca. 225 m2
Pris
Ca. 329,000EUR
Område
Hasselt, Limburg
Type
Commercial property
Commercial property in Maasmechelen, Limburg
 More info
Commercial property in Maasmechelen, Limburg
Commercial property for sale in Maasmechelen, Limburg
Areal
Ca. 1,455 m2
Pris
Ca. 1,295,000EUR
Område
Maasmechelen, Limburg
Type
Commercial property
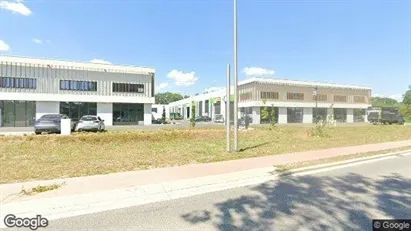
Commercial property in Sint-Katelijne-Waver, Antwerp (Province)
 More info
Commercial property in Sint-Katelijne-Waver, Antwerp (Province)
Commercial property for sale in Sint-Katelijne-Waver, Antwerp (Province)
Areal
Ca. 115 m2
Pris
Ca. 208,000EUR
Område
Sint-Katelijne-Waver, Antwerp (Province)
Type
Commercial property
Commercial space in Hasselt, Limburg
 More info
Commercial space in Hasselt, Limburg
Commercial space for rent in Hasselt, Limburg
Areal
Ca. 225 m2
Pris pr. md.
Ca. 1,300 EUR pr md
Område
Hasselt, Limburg
Type
Commercial property
Commercial property in Genk, Limburg
 More info
Commercial property in Genk, Limburg
Commercial property for sale in Genk, Limburg
Areal
Ca. 215 m2
Pris
Ca. 495,000EUR
Område
Genk, Limburg
Type
Commercial property
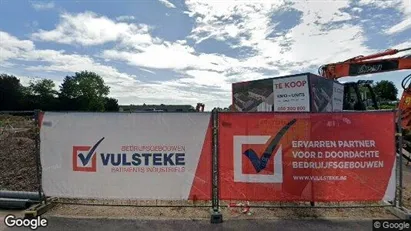
Commercial property in Sint-Katelijne-Waver, Antwerp (Province)
 More info
Commercial property in Sint-Katelijne-Waver, Antwerp (Province)
Commercial property for sale in Sint-Katelijne-Waver, Antwerp (Province)
Areal
Ca. 480 m2
Pris
Ca. 717,000EUR
Område
Sint-Katelijne-Waver, Antwerp (Province)
Type
Commercial property
Commercial property in Kortemark, West-Vlaanderen
 More info
Commercial property in Kortemark, West-Vlaanderen
Commercial property for sale in Kortemark, West-Vlaanderen
Areal
Ca. 140 m2
Pris
Ca. 207,000EUR
Område
Kortemark, West-Vlaanderen
Type
Commercial property
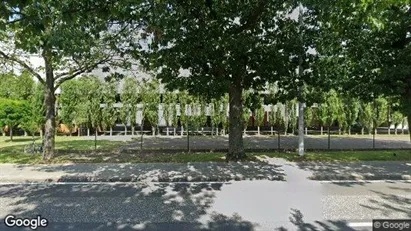
Commercial property in Sint-Katelijne-Waver, Antwerp (Province)
 More info
Commercial property in Sint-Katelijne-Waver, Antwerp (Province)
Commercial property for sale in Sint-Katelijne-Waver, Antwerp (Province)
Areal
Ca. 215 m2
Pris
Ca. 396,000EUR
Område
Sint-Katelijne-Waver, Antwerp (Province)
Type
Commercial property
Selected customers
30,000 customers use Companyspace.com
30,000 customers
285,000 companies in our database
2,400 rentals annually
Companyspace.com is used by thousands of landlords, property companies, commercial real estate agents, investors and business centres seeking greater visibility, more enquiries and lower vacancy rates.


