


Commercial premises for rent in United Kingdom
There are 5,520 available commercial properties in United Kingdom right now. Companyspace.com collects commercial properties from many different parts of the market, so that you as a company can more easily get an overview of available commercial properties in United Kingdom.
Companyspace.com today:
New today 1,201
Updated 24h 1,201
Notifications about new companyspaces2,174
Copenhagen +5
Stockholm +6
Amsterdam +27
Berlin +2
Oslo +3
Brussels +12
Vienna +77
Paris +3
Madrid +1
Dublin (county) +49
Warsaw +16
Roma (region) +2
Latest update 34 min ago
Active ads 368,547
5,520 company spaces found
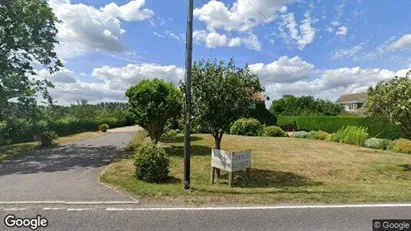
Commercial space in Boston - Lincolnshire, Peterborough (Region)
 More info
Commercial space in Boston - Lincolnshire, Peterborough (Region)
Commercial space for rent in Boston - Lincolnshire, Peterborough (Region)
Areal
-
Pris pr. md.
Ca. 2,100 GBP pr md
Område
Boston - Lincolnshire, Peterborough (Region)
Type
Commercial property
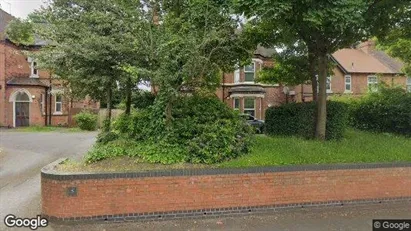
Commercial space in Boston - Lincolnshire, Peterborough (Region)
 More info
Commercial space in Boston - Lincolnshire, Peterborough (Region)
Commercial space for rent in Boston - Lincolnshire, Peterborough (Region)
Areal
-
Pris pr. md.
Ca. 1,850 GBP pr md
Område
Boston - Lincolnshire, Peterborough (Region)
Type
Commercial property
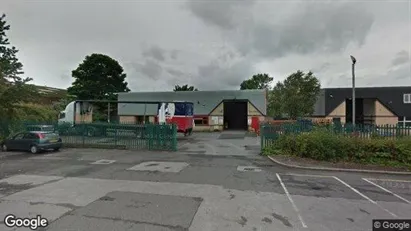
Office space in Birmingham - West Midlands, West Midlands
 More info
Office space in Birmingham - West Midlands, West Midlands
Office space for rent in Birmingham - West Midlands, West Midlands
Areal
Ca. 1,040 m2
Pris pr. md.
Not stated
Område
Birmingham - West Midlands, West Midlands
Type
Office space
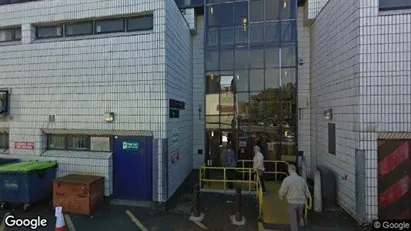
Industrial property in Hull - North Humberside, North East
 More info
Industrial property in Hull - North Humberside, North East
Production for rent in Hull - North Humberside, North East
Areal
Ca. 6,200 m2
Pris pr. md.
Ca. 42,000 GBP pr md
Område
Hull - North Humberside, North East
Type
Industrial property
Office space in Stoke-on-Trent - Staffordshire, West Midlands
 More info
Office space in Stoke-on-Trent - Staffordshire, West Midlands
Office space for rent in Stoke-on-Trent - Staffordshire, West Midlands
Areal
-
Pris pr. md.
Ca. 900 GBP pr md
Område
Stoke-on-Trent - Staffordshire, West Midlands
Type
Office space
Office space in Guildford - Surrey, South East
 More info
Office space in Guildford - Surrey, South East
Office space for rent in Guildford - Surrey, South East
Areal
Ca. 390 m2
Pris pr. md.
Ca. 9,750 GBP pr md
Område
Guildford - Surrey, South East
Type
Office space
Industrial property in Stoke-on-Trent - Staffordshire, West Midlands
 More info
Industrial property in Stoke-on-Trent - Staffordshire, West Midlands
Production for rent in Stoke-on-Trent - Staffordshire, West Midlands
Areal
-
Pris pr. md.
Ca. 1,050 GBP pr md
Område
Stoke-on-Trent - Staffordshire, West Midlands
Type
Industrial property
Industrial property in Leek - Staffordshire, West Midlands
 More info
Industrial property in Leek - Staffordshire, West Midlands
Production for rent in Leek - Staffordshire, West Midlands
Areal
-
Pris pr. md.
Ca. 800 GBP pr md
Område
Leek - Staffordshire, West Midlands
Type
Industrial property
Office space in Birmingham - West Midlands, West Midlands
 More info
Office space in Birmingham - West Midlands, West Midlands
Office space for rent in Birmingham - West Midlands, West Midlands
Areal
Ca. 1,930 m2
Pris pr. md.
Ca. 34,750 GBP pr md
Område
Birmingham - West Midlands, West Midlands
Type
Office space
Commercial space in Cumnock - Ayrshire, Kilmarnock (Region)
 More info
Commercial space in Cumnock - Ayrshire, Kilmarnock (Region)
Commercial space for rent in Cumnock - Ayrshire, Kilmarnock (Region)
Areal
Ca. 695 m2
Pris pr. md.
Ca. 5,500 GBP pr md
Område
Cumnock - Ayrshire, Kilmarnock (Region)
Type
Commercial property
Commercial space in Helensburgh - Dunbartonshire, Glasgow (Region)
 More info
Commercial space in Helensburgh - Dunbartonshire, Glasgow (Region)
Commercial space for rent in Helensburgh - Dunbartonshire, Glasgow (Region)
Areal
Ca. 1,005 m2
Pris pr. md.
Ca. 25,000 GBP pr md
Område
Helensburgh - Dunbartonshire, Glasgow (Region)
Type
Commercial property
Shop in Porthcawl - Mid Glamorgan, Cardiff (Region)
More info
We monitor the market!
Shop in Porthcawl - Mid Glamorgan, Cardiff (Region)
Retail space for rent in Porthcawl - Mid Glamorgan, Cardiff (Region)
Areal
-
Pris pr. md.
Ca. 1,500 GBP pr md
Område
Porthcawl - Mid Glamorgan, Cardiff (Region)
Type
Shop
Commercial space in Cumnock - Ayrshire, Kilmarnock (Region)
 More info
Commercial space in Cumnock - Ayrshire, Kilmarnock (Region)
Commercial space for rent in Cumnock - Ayrshire, Kilmarnock (Region)
Areal
Ca. 620 m2
Pris pr. md.
Ca. 6,500 GBP pr md
Område
Cumnock - Ayrshire, Kilmarnock (Region)
Type
Commercial property
Commercial space in Cowbridge - South Glamorgan, Cardiff (Region)
 More info
Commercial space in Cowbridge - South Glamorgan, Cardiff (Region)
Commercial space for rent in Cowbridge - South Glamorgan, Cardiff (Region)
Areal
-
Pris pr. md.
Ca. 1,200 GBP pr md
Område
Cowbridge - South Glamorgan, Cardiff (Region)
Type
Commercial property
Commercial space in Glasgow - Lanarkshire, Glasgow (Region)
 More info
Commercial space in Glasgow - Lanarkshire, Glasgow (Region)
Commercial space for rent in Glasgow - Lanarkshire, Glasgow (Region)
Areal
-
Pris pr. md.
Ca. 15,000 GBP pr md
Område
Glasgow - Lanarkshire, Glasgow (Region)
Type
Commercial property
Commercial space in Irvine - Ayrshire, Kilmarnock (Region)
 More info
Commercial space in Irvine - Ayrshire, Kilmarnock (Region)
Commercial space for rent in Irvine - Ayrshire, Kilmarnock (Region)
Areal
Ca. 18,185 m2
Pris pr. md.
Ca. 40,000 GBP pr md
Område
Irvine - Ayrshire, Kilmarnock (Region)
Type
Commercial property
Commercial space in Lanark - Lanarkshire, Motherwell (Region)
 More info
Commercial space in Lanark - Lanarkshire, Motherwell (Region)
Commercial space for rent in Lanark - Lanarkshire, Motherwell (Region)
Areal
Ca. 9,850 m2
Pris pr. md.
Ca. 35,000 GBP pr md
Område
Lanark - Lanarkshire, Motherwell (Region)
Type
Commercial property
Commercial space in Stoke-on-Trent - Staffordshire, West Midlands
 More info
Commercial space in Stoke-on-Trent - Staffordshire, West Midlands
Commercial space for rent in Stoke-on-Trent - Staffordshire, West Midlands
Areal
-
Pris pr. md.
Ca. 1,850 GBP pr md
Område
Stoke-on-Trent - Staffordshire, West Midlands
Type
Commercial property
Selected customers
30,000 customers use Companyspace.com
30,000 customers
285,000 companies in our database
2,400 rentals annually
Companyspace.com is used by thousands of landlords, property companies, commercial real estate agents, investors and business centres seeking greater visibility, more enquiries and lower vacancy rates.


