


Commercial property for rent in United Kingdom
There are 2,148 available commercial properties in United Kingdom right now. Companyspace.com collects commercial properties from many different parts of the market, so that you as a company can more easily get an overview of available commercial properties in United Kingdom.
Companyspace.com today:
New today 870
Updated 24h 3,486
Notifications about new companyspaces6,708
Copenhagen +1
Stockholm +1
Berlin +115
Vienna +12
Roma (region) +1
Greater London +1
Latest update 4 min ago
Active ads 365,917
2,148 commercial properties found
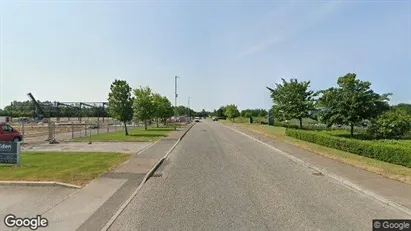
Commercial space in Bury - Lancashire, North West
 More info
Commercial space in Bury - Lancashire, North West
Commercial space for rent in Bury - Lancashire, North West
Areal
-
Pris pr. md.
Ca. 100 GBP pr md
Område
Bury - Lancashire, North West
Type
Commercial property
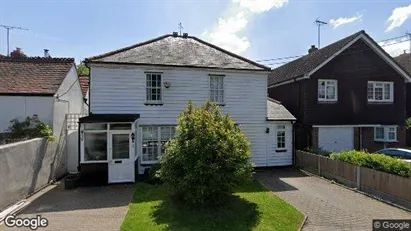
Commercial space in Sandy - Bedfordshire, East of England
More info
Commercial space in Sandy - Bedfordshire, East of England
Commercial space for rent in Sandy - Bedfordshire, East of England
Areal
-
Pris pr. md.
Ca. 1,500 GBP pr md
Område
Sandy - Bedfordshire, East of England
Type
Commercial property
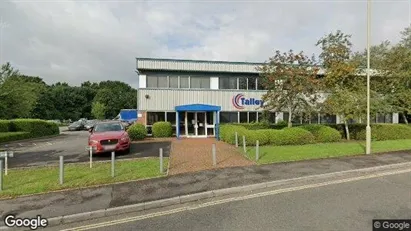
Commercial space in Boston - Lincolnshire, Peterborough (Region)
 More info
Commercial space in Boston - Lincolnshire, Peterborough (Region)
Commercial space for rent in Boston - Lincolnshire, Peterborough (Region)
Areal
-
Pris pr. md.
Ca. 1,700 GBP pr md
Område
Boston - Lincolnshire, Peterborough (Region)
Type
Commercial property
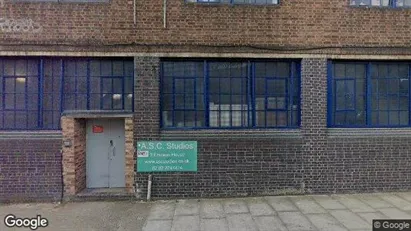
Commercial space in Wickford - Essex, East of England
 More info
Commercial space in Wickford - Essex, East of England
Commercial space for rent in Wickford - Essex, East of England
Areal
-
Pris pr. md.
Ca. 2,800 GBP pr md
Område
Wickford - Essex, East of England
Type
Commercial property
Commercial space in Romsey - Hampshire, South East
 More info
Commercial space in Romsey - Hampshire, South East
Commercial space for rent in Romsey - Hampshire, South East
Areal
Ca. 4,880 m2
Pris pr. md.
Ca. 81,200 GBP pr md
Område
Romsey - Hampshire, South East
Type
Commercial property
Commercial space in London E3, Greater London
 More info
Commercial space in London E3, Greater London
Commercial space for rent in London E3, Greater London
Areal
Ca. 665 m2
Pris pr. md.
Ca. 17,500 GBP pr md
Område
London E3, Greater London
Type
Commercial property
Commercial space in Wickford - Essex, East of England
 More info
Commercial space in Wickford - Essex, East of England
Commercial space for rent in Wickford - Essex, East of England
Areal
-
Pris pr. md.
Ca. 1,800 GBP pr md
Område
Wickford - Essex, East of England
Type
Commercial property
Commercial space in New Malden - Surrey, Greater London
 More info
Commercial space in New Malden - Surrey, Greater London
Commercial space for rent in New Malden - Surrey, Greater London
Areal
-
Pris pr. md.
Ca. 350 GBP pr md
Område
New Malden - Surrey, Greater London
Type
Commercial property
Commercial space in Cumnock - Ayrshire, Kilmarnock (Region)
 More info
Commercial space in Cumnock - Ayrshire, Kilmarnock (Region)
Commercial space for rent in Cumnock - Ayrshire, Kilmarnock (Region)
Areal
Ca. 620 m2
Pris pr. md.
Ca. 6,500 GBP pr md
Område
Cumnock - Ayrshire, Kilmarnock (Region)
Type
Commercial property
Commercial space in Glasgow - Lanarkshire, Glasgow (Region)
 More info
Commercial space in Glasgow - Lanarkshire, Glasgow (Region)
Commercial space for rent in Glasgow - Lanarkshire, Glasgow (Region)
Areal
-
Pris pr. md.
Ca. 15,000 GBP pr md
Område
Glasgow - Lanarkshire, Glasgow (Region)
Type
Commercial property
Commercial space in Greenock - Renfrewshire, Paisley (Region)
 More info
Commercial space in Greenock - Renfrewshire, Paisley (Region)
Commercial space for rent in Greenock - Renfrewshire, Paisley (Region)
Areal
-
Pris pr. md.
Ca. 1,500 GBP pr md
Område
Greenock - Renfrewshire, Paisley (Region)
Type
Commercial property
Commercial space in Greenock - Renfrewshire, Paisley (Region)
 More info
Commercial space in Greenock - Renfrewshire, Paisley (Region)
Commercial space for rent in Greenock - Renfrewshire, Paisley (Region)
Areal
-
Pris pr. md.
Ca. 2,100 GBP pr md
Område
Greenock - Renfrewshire, Paisley (Region)
Type
Commercial property
Commercial space in Brentwood - Essex, East of England
 More info
Commercial space in Brentwood - Essex, East of England
Commercial space for rent in Brentwood - Essex, East of England
Areal
-
Pris pr. md.
Ca. 150 GBP pr md
Område
Brentwood - Essex, East of England
Type
Commercial property
Commercial space in Brentwood - Essex, East of England
 More info
Commercial space in Brentwood - Essex, East of England
Commercial space for rent in Brentwood - Essex, East of England
Areal
-
Pris pr. md.
Ca. 2,850 GBP pr md
Område
Brentwood - Essex, East of England
Type
Commercial property
Commercial space in Kingston upon Thames - Surrey, Greater London
 More info
Commercial space in Kingston upon Thames - Surrey, Greater London
Commercial space for rent in Kingston upon Thames - Surrey, Greater London
Areal
-
Pris pr. md.
Ca. 2,300 GBP pr md
Område
Kingston upon Thames - Surrey, Greater London
Type
Commercial property
Commercial space in London E17, Greater London
 More info
Commercial space in London E17, Greater London
Commercial space for rent in London E17, Greater London
Areal
-
Pris pr. md.
Ca. 75,000 GBP pr md
Område
London E17, Greater London
Type
Commercial property
Commercial space in Llanelli - Dyfed, Swansea (Region)
 More info
Commercial space in Llanelli - Dyfed, Swansea (Region)
Commercial space for rent in Llanelli - Dyfed, Swansea (Region)
Areal
Ca. 230 m2
Pris pr. md.
Ca. 1,650 GBP pr md
Område
Llanelli - Dyfed, Swansea (Region)
Type
Commercial property
Commercial space in Cowbridge - South Glamorgan, Cardiff (Region)
 More info
Commercial space in Cowbridge - South Glamorgan, Cardiff (Region)
Commercial space for rent in Cowbridge - South Glamorgan, Cardiff (Region)
Areal
-
Pris pr. md.
Ca. 1,200 GBP pr md
Område
Cowbridge - South Glamorgan, Cardiff (Region)
Type
Commercial property
Selected customers
30,000 customers use Companyspace.com
30,000 customers
285,000 companies in our database
2,400 rentals annually
Companyspace.com is used by thousands of landlords, property companies, commercial real estate agents, investors and business centres seeking greater visibility, more enquiries and lower vacancy rates.


