


Industrial property for rent in Cabrillas
These commercial premises are closest to your search
We currently have no available commercial premises registered that match your search exactly. Therefore, we show below the commercial premises that best match your search based on the current market.
The shown listings may differ from your original search in terms of, for example, premises type, location, size or price, but they have been selected because they may be relevant alternatives for your business.
Take a look at the suggestions below – or start your search again here.
Companyspace.com today:
New today 11
Updated 24h 1,226
Latest update 1 min ago
Active ads 368,742
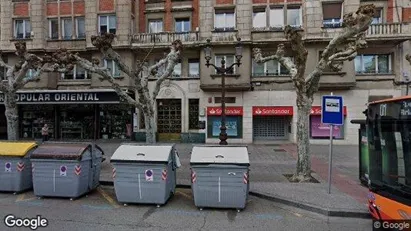
Commercial space in Burgos, Castilla y León
 More info
Commercial space in Burgos, Castilla y León
Commercial space for rent in Burgos, Castilla y León
Areal
Ca. 10 m2
Pris pr. md.
Ca. 150 EUR pr md
Område
Burgos, Castilla y León
Type
Commercial property
Commercial space in Valladolid, Castilla y León
 More info
Commercial space in Valladolid, Castilla y León
Commercial space for rent in Valladolid, Castilla y León
Areal
Ca. 10 m2
Pris pr. md.
Ca. 100 EUR pr md
Område
Valladolid, Castilla y León
Type
Commercial property
Office space in Valladolid, Castilla y León
 More info
Office space in Valladolid, Castilla y León
Office space for rent in Valladolid, Castilla y León
Areal
-
Pris pr. md.
Ca. 350 EUR pr md
Område
Valladolid, Castilla y León
Type
Office space
Office space in Burgos, Castilla y León
 More info
Office space in Burgos, Castilla y León
Office space for rent in Burgos, Castilla y León
Areal
Ca. 380 m2
Pris pr. md.
Not stated
Område
Burgos, Castilla y León
Type
Office space
Office property in Valladolid, Castilla y León
 More info
Office property in Valladolid, Castilla y León
Office space for sale in Valladolid, Castilla y León
Areal
-
Pris
Ca. 324,000EUR
Område
Valladolid, Castilla y León
Type
Office space
Office property in Valladolid, Castilla y León
 More info
Office property in Valladolid, Castilla y León
Office space for sale in Valladolid, Castilla y León
Areal
-
Pris
Ca. 1,300,000EUR
Område
Valladolid, Castilla y León
Type
Office space
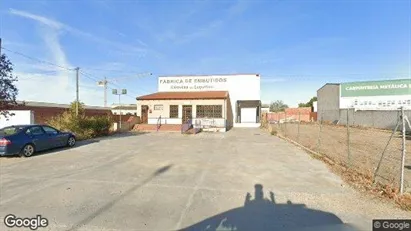
Industrial property in Mojados, Castilla y León
 More info
Industrial property in Mojados, Castilla y León
Industrial property for sale in Mojados, Castilla y León
Areal
-
Pris
Ca. 390,000EUR
Område
Mojados, Castilla y León
Type
Industrial property
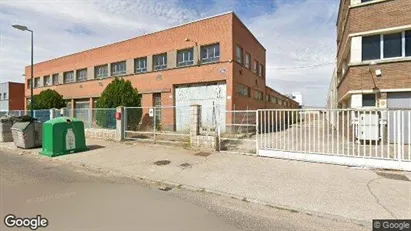
Industrial property in Valladolid, Castilla y León
 More info
Industrial property in Valladolid, Castilla y León
Industrial property for sale in Valladolid, Castilla y León
Areal
-
Pris
Ca. 172,000EUR
Område
Valladolid, Castilla y León
Type
Industrial property
Commercial space in Burgos, Castilla y León
 More info
Commercial space in Burgos, Castilla y León
Commercial space for rent in Burgos, Castilla y León
Areal
Ca. 5 m2
Pris pr. md.
Ca. 150 EUR pr md
Område
Burgos, Castilla y León
Type
Commercial property
Office space in León, Castilla y León
 More info
Office space in León, Castilla y León
Office space for rent in León, Castilla y León
Areal
15 - 40 m2
Pris pr. md.
Ca. 50 EUR pr md
Område
León, Castilla y León
Type
Office space
Commercial property in Balboa, Castilla y León
More info
We monitor the market!
Commercial property in Balboa, Castilla y León
Commercial property En venta en Balboa, Castilla y León
Areal
Ca. 65 m2
Pris
Ca. 1,600,000EUR
Område
Balboa, Castilla y León
Type
Commercial property
Retail property in Valladolid, Castilla y León
More info
We monitor the market!
Retail property in Valladolid, Castilla y León
Shop for sale in Valladolid, Castilla y León
Areal
-
Pris
Ca. 28,000EUR
Område
Valladolid, Castilla y León
Type
Shop
Commercial space in Alba de Tormes, Castilla y León
More info
We monitor the market!
Commercial space in Alba de Tormes, Castilla y León
Commercial space for rent in Alba de Tormes, Castilla y León
Areal
Ca. 75 m2
Pris pr. md.
Ca. 800 EUR pr md
Område
Alba de Tormes, Castilla y León
Type
Commercial property
Office space in Salamanca, Castilla y León
More info
We monitor the market!
Office space in Salamanca, Castilla y León
Office space for rent in Salamanca, Castilla y León
Areal
Ca. 1,450 m2
Pris pr. md.
Ca. 47,000 EUR pr md
Område
Salamanca, Castilla y León
Type
Office space
Shop in Valladolid, Castilla y León
More info
We monitor the market!
Shop in Valladolid, Castilla y León
Shop for rent in Valladolid, Castilla y León
Areal
-
Pris pr. md.
Ca. 500 EUR pr md
Område
Valladolid, Castilla y León
Type
Shop
Shop in Valladolid, Castilla y León
More info
We monitor the market!
Shop in Valladolid, Castilla y León
Shop for rent in Valladolid, Castilla y León
Areal
-
Pris pr. md.
Ca. 750 EUR pr md
Område
Valladolid, Castilla y León
Type
Shop
Shop in Valladolid, Castilla y León
More info
We monitor the market!
Shop in Valladolid, Castilla y León
Shop for rent in Valladolid, Castilla y León
Areal
-
Pris pr. md.
Ca. 300 EUR pr md
Område
Valladolid, Castilla y León
Type
Shop
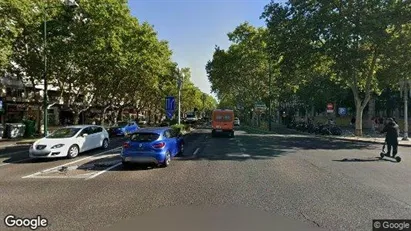
Commercial space in Salamanca, Castilla y León
More info
We monitor the market!
Commercial space in Salamanca, Castilla y León
Commercial space En alquiler en Salamanca, Castilla y León
Areal
Ca. 130 m2
Pris pr. md.
Ca. 1,600 EUR pr md
Område
Salamanca, Castilla y León
Type
Commercial property
Selected customers
30,000 customers use Companyspace.com
30,000 customers
285,000 companies in our database
2,400 rentals annually
Companyspace.com is used by thousands of landlords, property companies, commercial real estate agents, investors and business centres seeking greater visibility, more enquiries and lower vacancy rates.


