


Clinic for rent in Cirueña
These commercial premises are closest to your search
We currently have no available commercial premises registered that match your search exactly. Therefore, we show below the commercial premises that best match your search based on the current market.
The shown listings may differ from your original search in terms of, for example, premises type, location, size or price, but they have been selected because they may be relevant alternatives for your business.
Take a look at the suggestions below – or start your search again here.
Companyspace.com today:
New today 84
Updated 24h 1,124
Copenhagen +5
Vienna +1
Latest update 1 min ago
Active ads 364,189
Commercial space in Villarroya, La Rioja
 More info
Commercial space in Villarroya, La Rioja
Commercial space for rent in Villarroya, La Rioja
Areal
Ca. 225 m2
Pris pr. md.
Ca. 1,300 EUR per month
Område
Villarroya, La Rioja
Type
Commercial property
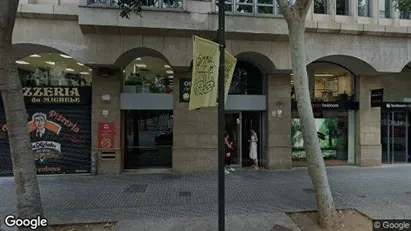
Office space in Santa Coloma, La Rioja
 More info
Office space in Santa Coloma, La Rioja
Office space for rent in Santa Coloma, La Rioja
Areal
Ca. 90 m2
Pris pr. md.
Ca. 650 EUR per month
Område
Santa Coloma, La Rioja
Type
Office space
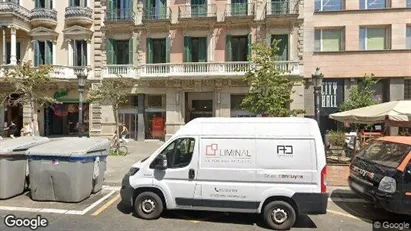
Commercial space in Santa Coloma, La Rioja
More info
Commercial space in Santa Coloma, La Rioja
Commercial space for rent in Santa Coloma, La Rioja
Areal
Ca. 90 m2
Pris pr. md.
Ca. 650 EUR per month
Område
Santa Coloma, La Rioja
Type
Commercial property
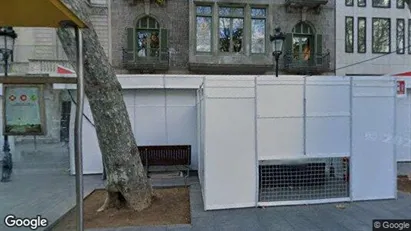
Commercial space in Santa Coloma, La Rioja
More info
Commercial space in Santa Coloma, La Rioja
Commercial space for rent in Santa Coloma, La Rioja
Areal
Ca. 120 m2
Pris pr. md.
Ca. 500 EUR per month
Område
Santa Coloma, La Rioja
Type
Commercial property
Industrial property in Santa Coloma, La Rioja
 More info
Industrial property in Santa Coloma, La Rioja
Propiedad industrial En alquiler en Santa Coloma, La Rioja
Areal
Ca. 705 m2
Pris pr. md.
Ca. 700 EUR per month
Område
Santa Coloma, La Rioja
Type
Industrial property
Office space in Pradillo, La Rioja
More info
Office space in Pradillo, La Rioja
Office space for rent in Pradillo, La Rioja
Areal
Ca. 5 m2
Pris pr. md.
Not stated
Område
Pradillo, La Rioja
Type
Office space
Retail property in Cordovín, La Rioja
 More info
Retail property in Cordovín, La Rioja
Shop for sale in Cordovín, La Rioja
Areal
-
Pris
N/A
Område
Cordovín, La Rioja
Type
Shop
Warehouse in El Villar de Arnedo, La Rioja
 More info
Warehouse in El Villar de Arnedo, La Rioja
Warehouse for rent in El Villar de Arnedo, La Rioja
Areal
Ca. 2,455 m2
Pris pr. md.
Not stated
Område
El Villar de Arnedo, La Rioja
Type
Warehouse
Industrial property in El Villar de Arnedo, La Rioja
More info
Industrial property in El Villar de Arnedo, La Rioja
Industrial property for rent in El Villar de Arnedo, La Rioja
Areal
Ca. 500 m2
Pris pr. md.
Not stated
Område
El Villar de Arnedo, La Rioja
Type
Industrial property
Office space in La Rioja
 More info
Office space in La Rioja
Office space for rent in La Rioja
Areal
Ca. 570 m2
Pris pr. md.
Ca. 9,700 EUR per month
Område
La Rioja
Type
Office space
Office space in La Rioja
 More info
Office space in La Rioja
Office space for rent in La Rioja
Areal
Ca. 445 m2
Pris pr. md.
Ca. 9,350 EUR per month
Område
La Rioja
Type
Office space
Office space in La Rioja
 More info
Office space in La Rioja
Office space for rent in La Rioja
Areal
Ca. 180 m2
Pris pr. md.
Ca. 4,350 EUR per month
Område
La Rioja
Type
Office space
Office space in La Rioja
 More info
Office space in La Rioja
Office space for rent in La Rioja
Areal
Ca. 710 m2
Pris pr. md.
Ca. 17,100 EUR per month
Område
La Rioja
Type
Office space
Office space in La Rioja
 More info
Office space in La Rioja
Office space for rent in La Rioja
Areal
Ca. 245 m2
Pris pr. md.
Ca. 3,150 EUR per month
Område
La Rioja
Type
Office space
Office space in La Rioja
 More info
Office space in La Rioja
Office space for rent in La Rioja
Areal
Ca. 265 m2
Pris pr. md.
Ca. 3,300 EUR per month
Område
La Rioja
Type
Office space
Office space in La Rioja
 More info
Office space in La Rioja
Office space for rent in La Rioja
Areal
Ca. 340 m2
Pris pr. md.
Ca. 6,800 EUR per month
Område
La Rioja
Type
Office space
Office space in La Rioja
 More info
Office space in La Rioja
Office space for rent in La Rioja
Areal
Ca. 70 m2
Pris pr. md.
Ca. 1,550 EUR per month
Område
La Rioja
Type
Office space
Office space in La Rioja
 More info
Office space in La Rioja
Office space for rent in La Rioja
Areal
Ca. 2,320 m2
Pris pr. md.
Ca. 41,000 EUR per month
Område
La Rioja
Type
Office space
Selected customers
Selected customers
30,000 customers use Companyspace.com
30,000 customers
285,000 companies in our database
2,400 rentals annually
Companyspace.com is used by thousands of landlords, property companies, commercial real estate agents, investors and business centres seeking greater visibility, more enquiries and lower vacancy rates.


