


Office space for rent in Europe
There are 129,703 available office spaces in Europe right now. Companyspace.com collects office spaces from many different parts of the market, so that you as a company can more easily get an overview of available office spaces in Europe.
Companyspace.com today:
New today 2,911
Updated 24h 3,925
Notifications about new companyspaces2,086
Copenhagen +4
Stockholm +1
Amsterdam +3
Berlin +3
Vienna +6
Paris +5
Madrid +4
Dublin (county) +23
Warsaw +19
Greater London +13
Latest update 1 min ago
Active ads 369,195
129,703 office spaces found
Office space in Horsens, Central Jutland Region
 More info
Office space in Horsens, Central Jutland Region
Office space for rent in Horsens, Central Jutland Region
Areal
Ca. 160 m2
Pris pr. md.
Ca. 7,350 DKK pr md
Område
Horsens, Central Jutland Region
Type
Office space
Office space in Allerød, North Zealand
 More info
Office space in Allerød, North Zealand
Office space for rent in Allerød, North Zealand
Areal
Ca. 300 m2
Pris pr. md.
Ca. 21,100 DKK pr md
Område
Allerød, North Zealand
Type
Office space
Office space in Sigtuna, Stockholm County
More info
Office space in Sigtuna, Stockholm County
Office space for rent in Sigtuna, Stockholm County
Areal
Ca. 65 m2
Pris pr. md.
Ca. 1,800 SEK pr md
Område
Sigtuna, Stockholm County
Type
Office space
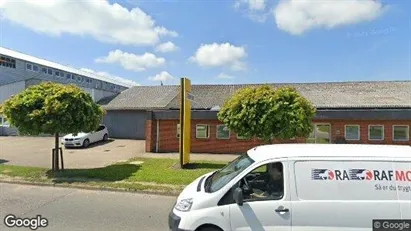
Office space in Vojens, Region of Southern Denmark
 More info
Office space in Vojens, Region of Southern Denmark
Office space for rent in Vojens, Region of Southern Denmark
Areal
Ca. 505 m2
Pris pr. md.
Ca. 12,600 DKK pr md
Område
Vojens, Region of Southern Denmark
Type
Office space
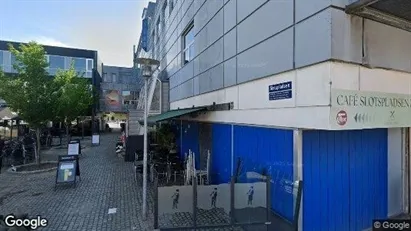
Office space in Randers C, Randers
 More info
Office space in Randers C, Randers
Office space for rent in Randers C, Randers
Areal
Ca. 375 m2
Pris pr. md.
Ca. 24,850 DKK pr md
Område
Randers C, Randers
Type
Office space
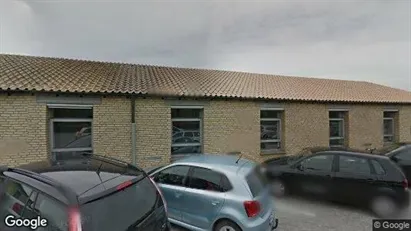
Office space in Vojens, Region of Southern Denmark
 More info
Office space in Vojens, Region of Southern Denmark
Office space for rent in Vojens, Region of Southern Denmark
Areal
Ca. 405 m2
Pris pr. md.
Ca. 10,100 DKK pr md
Område
Vojens, Region of Southern Denmark
Type
Office space
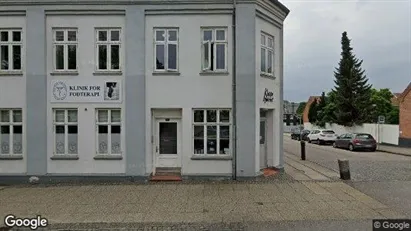
Office space in Køge, Greater Copenhagen
 More info
Office space in Køge, Greater Copenhagen
Office space for rent in Køge, Greater Copenhagen
Areal
Ca. 140 m2
Pris pr. md.
Ca. 15,050 DKK pr md
Område
Køge, Greater Copenhagen
Type
Office space
Office space in Södermalm, Stockholm
More info
Office space in Södermalm, Stockholm
Office space for rent in Södermalm, Stockholm
Areal
Ca. 20 m2
Pris pr. md.
Ca. 16,950 SEK pr md
Område
Södermalm, Stockholm
Type
Office space
Office space in Södermalm, Stockholm
More info
Office space in Södermalm, Stockholm
Office space for rent in Södermalm, Stockholm
Areal
Ca. 15 m2
Pris pr. md.
Ca. 20,900 SEK pr md
Område
Södermalm, Stockholm
Type
Office space
Office space in Hillerød, North Zealand
More info
Office space in Hillerød, North Zealand
Office space for rent in Hillerød, North Zealand
Areal
Ca. 150 m2
Pris pr. md.
Ca. 18,650 DKK pr md
Område
Hillerød, North Zealand
Type
Office space
Office space in Dublin 1, Dublin
 More info
Office space in Dublin 1, Dublin
Office space for rent in Dublin 1, Dublin
Areal
Ca. 35 m2
Pris pr. md.
Ca. 1,100 EUR pr md
Område
Dublin 1, Dublin
Type
Office space
Office space in Odder, Central Jutland Region
 More info
Office space in Odder, Central Jutland Region
Office space for rent in Odder, Central Jutland Region
Areal
Ca. 540 m2
Pris pr. md.
Ca. 31,250 DKK pr md
Område
Odder, Central Jutland Region
Type
Office space
Office space in Herning, Central Jutland Region
 More info
Office space in Herning, Central Jutland Region
Office space for rent in Herning, Central Jutland Region
Areal
Ca. 1,840 m2
Pris pr. md.
Ca. 84,450 DKK pr md
Område
Herning, Central Jutland Region
Type
Office space
Office space in Vojens, Region of Southern Denmark
 More info
Office space in Vojens, Region of Southern Denmark
Office space for rent in Vojens, Region of Southern Denmark
Areal
Ca. 530 m2
Pris pr. md.
Ca. 13,250 DKK pr md
Område
Vojens, Region of Southern Denmark
Type
Office space
Office space in Södermalm, Stockholm
More info
Office space in Södermalm, Stockholm
Office space for rent in Södermalm, Stockholm
Areal
Ca. 30 m2
Pris pr. md.
Ca. 26,550 SEK pr md
Område
Södermalm, Stockholm
Type
Office space
Office space in Västervik, Kalmar County
More info
Office space in Västervik, Kalmar County
Office space for rent in Västervik, Kalmar County
Areal
-
Pris pr. md.
Ca. 3,000 SEK pr md
Område
Västervik, Kalmar County
Type
Office space
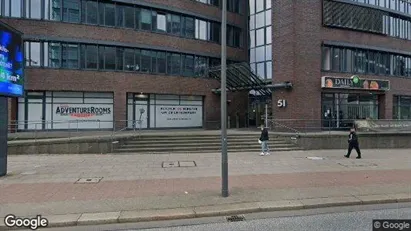
Office space in Hamburg Mitte, Hamburg
 More info
Office space in Hamburg Mitte, Hamburg
Office space for rent in Hamburg Mitte, Hamburg
Areal
223 - 2,187 m2
Pris pr. md.
Not stated
Område
Hamburg Mitte, Hamburg
Type
Office space
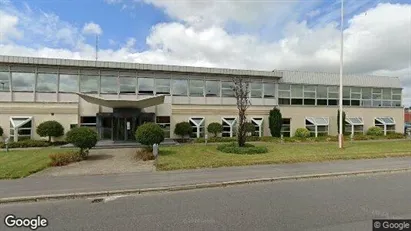
Office space in Horsens, Central Jutland Region
More info
Office space in Horsens, Central Jutland Region
Office space for rent in Horsens, Central Jutland Region
Areal
Ca. 60 m2
Pris pr. md.
Not stated
Område
Horsens, Central Jutland Region
Type
Office space
Selected customers
30,000 customers use Companyspace.com
30,000 customers
285,000 companies in our database
2,400 rentals annually
Companyspace.com is used by thousands of landlords, property companies, commercial real estate agents, investors and business centres seeking greater visibility, more enquiries and lower vacancy rates.


